Figure S5.
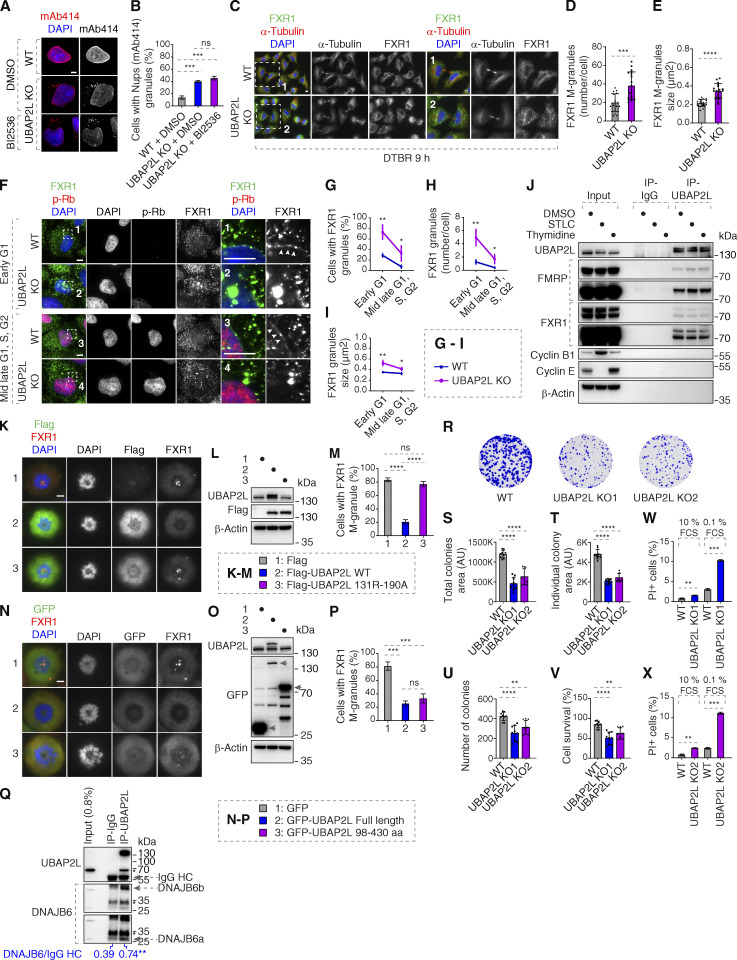
UBAP2L regulates FXRP proteins and promotes survival of HeLa cells. (A and B) Representative immunofluorescence images depicting the localization of Nups (mAb414) in WT and UBAP2L KO HeLa cells synchronized in interphase by DTBR at 12 h. PLK1 inhibitor BI 2536 (or solvent control) was used at a concentration of 100 nM for 45 min prior to sample collection. Nuclei were stained with DAPI. Scale bar, 5 μm (A). The percentage of cells with the cytoplasmic granules containing Nups (mAb414) shown in A was quantified (B). At least 150 cells per condition were analyzed (mean ± SD, ns: not significant, ***P < 0.001, unpaired two-tailed t test, n = 3 independent experiments). (C–E) Representative immunofluorescence images depicting the localization of FXR1 in WT and UBAP2L KO HeLa cells synchronized by DTBR 9 h in late telophase. Nuclei were stained with DAPI. The magnified framed regions are shown in the corresponding numbered panels. Scale bars, 5 μm (C). The number of FXR1 granules per cell (number/cell) (D) and the size of FXR1 granules (granule ≥ 0.105 µm2) (E) shown in C were quantified (mean ± SD, ***P < 0.001, ****P < 0.0001, unpaired two-tailed t test. 17 WT and 18 UBAP2L KO HeLa cells were counted, respectively). (F–I) Representative immunofluorescence images depicting the localization of FXR1 in different cell cycle stages in asynchronously proliferating WT and UBAP2L KO HeLa cells. p-Rb was used to distinguish between early G1 (p-Rb–negative cells) and mid-late G1, S, and G2 (p-Rb–positive cells) stages. Nuclei were stained with DAPI. The arrowheads indicate the NE localization of endogenous FXR1. Scale bars, 5 μm (F). The percentage of cells with cytoplasmic FXR1 granules (G), the number of FXR1 granules per cell (number/cell) (H), and the size of FXR1 granules (granule ≥ 0.2109 µm2) (I) shown in F were quantified. At least 200 cells per condition were analyzed (mean ± SD, *P < 0.05, **P < 0.01, unpaired two-tailed t test, n = 3 independent experiments). (J) IPs from HeLa cells lysates of asynchronously proliferating cells (DMSO 16 h), cells synchronized in mitosis (STLC 16 h) or in interphase (thymidine 16 h) using UBAP2L antibody or IgG were analyzed by western blot. (K–M) HeLa cells expressing Flag, Flag-UBAP2L WT, or Flag-UBAP2L R131–190A for 27 h were synchronized in prometaphase using STCL for 16 h and representative immunofluorescence images depicting localization of FXR1 are shown in K. Chromosomes were stained with DAPI. Scale bar, 5 μm. The protein levels of Flag-UBAP2L and endogenous UBAP2L in K were analyzed by western blot (L). The percentage of cells with FXR1-granules shown in K was quantified (M). At least 200 cells per condition were analyzed (mean ± SD, ns: not significant, ****P < 0.0001, unpaired two-tailed t test, n = 3 independent experiments). (N–P) Representative immunofluorescence images depicting the localization of FXR1 in HeLa cells expressing GFP, GFP-UBAP2L FL, or GFP-UBAP2L 98–430 aa for 27 h synchronized in prometaphase using STCL for 16 h. Chromosomes were stained with DAPI. Scale bar, 5 μm (N). The protein levels of GFP-UBAP2L and endogenous UBAP2L in N were analyzed by western blot (O). The percentage of cells with FXR1-granules shown in N was quantified (P). At least 200 cells per condition were analyzed (mean ± SD, ns: not significant, ***P < 0.001, unpaired two-tailed t test, n = 3 independent experiments). (Q) HeLa cells lysates were immunoprecipitated using UBAP2L antibody or IgG, analyzed by western blot, and signal intensities were quantified (shown a mean value, **P < 0.01, unpaired two-tailed t test; N = 3). The arrows indicate the bands corresponding to the IgG heavy chain (HC). (R–V) Representative images of colony formation assays of WT and UBAP2L KO HeLa cells maintained in culture for 7 days (R). Total colony area (S), individual colony area (T), average number of colonies (U), and cell survival (V) of cells shown in R were quantified using the Fiji software (mean ± SD, **P < 0.01, ****P < 0.0001; one-way ANOVA, n = 3 independent experiments). (W and X) The percentage of PI-positive cells in WT and UBAP2L KO HeLa cells cultured in the indicated concentrations of serum for 72 h were quantified by fluorescence activated cell sorting (mean ± SD, **P < 0.01, ***P < 0.001, unpaired two-tailed t test, n = 3 independent experiments). Source data are available for this figure: SourceData FS5.

