Figure 4.
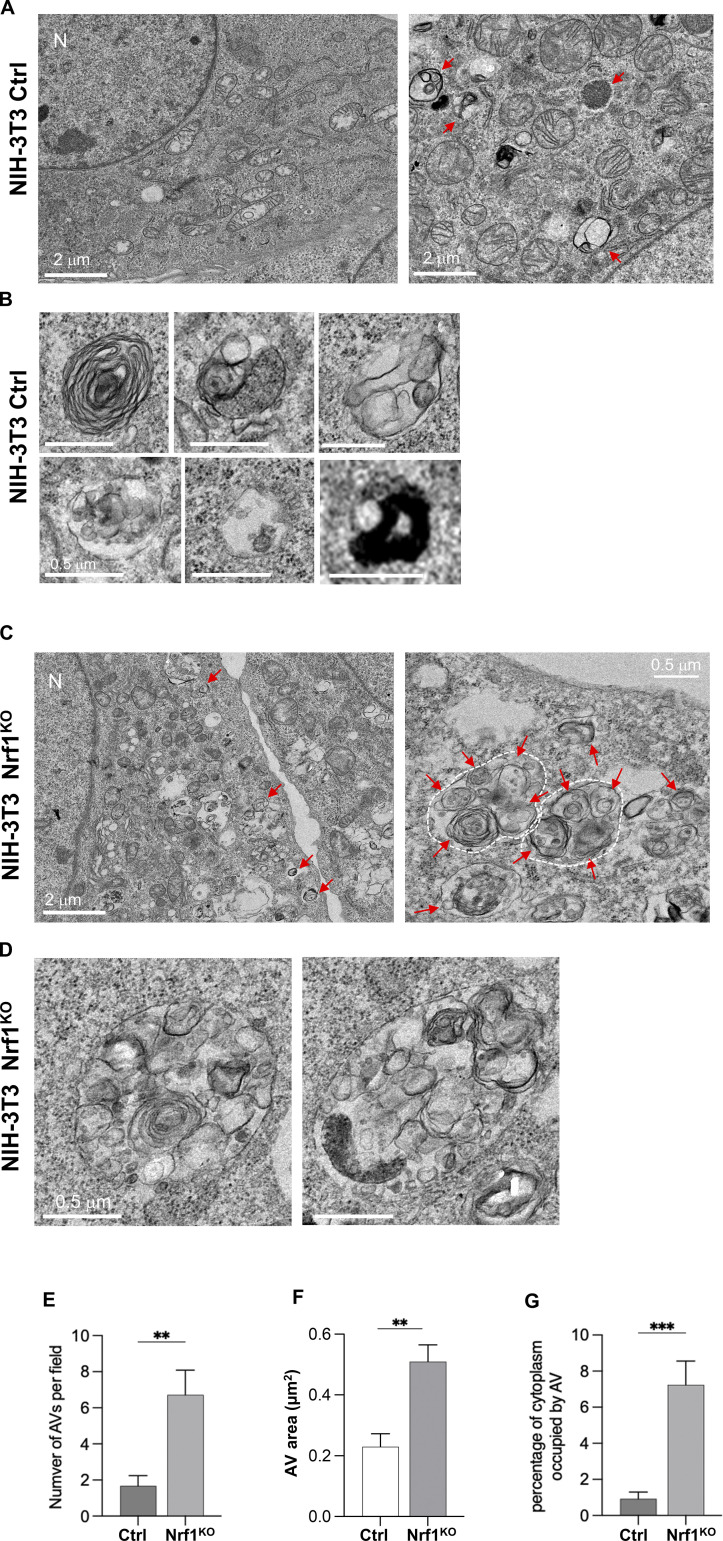
Nrf1KO cells display defective autophagy in response to proteasome inhibition. (A and B) Transmission electron microscopy (TEM) images of NIH-3T3 control (ctrl) cells treated with 200 nM CFZ for 20 h with B showing zoom insets. (C and D) TEM images of Nrf1KO cells treated with 200 nM CFZ for 20 h with D showing zoom insets. Multiautophagosomal structures (white dash outlines) are visible in the Nrf1KO cells. N: nucleus; red arrows: autophagic vacuoles (AV). (E–G) Quantification shows the number of AV per field in E, the area of AV in F, and the percentage of cytoplasm occupied by AV in G. P values were calculated by Student’s t test. **P < 0.01, ***P < 0.001, n = 9–10 fields.

