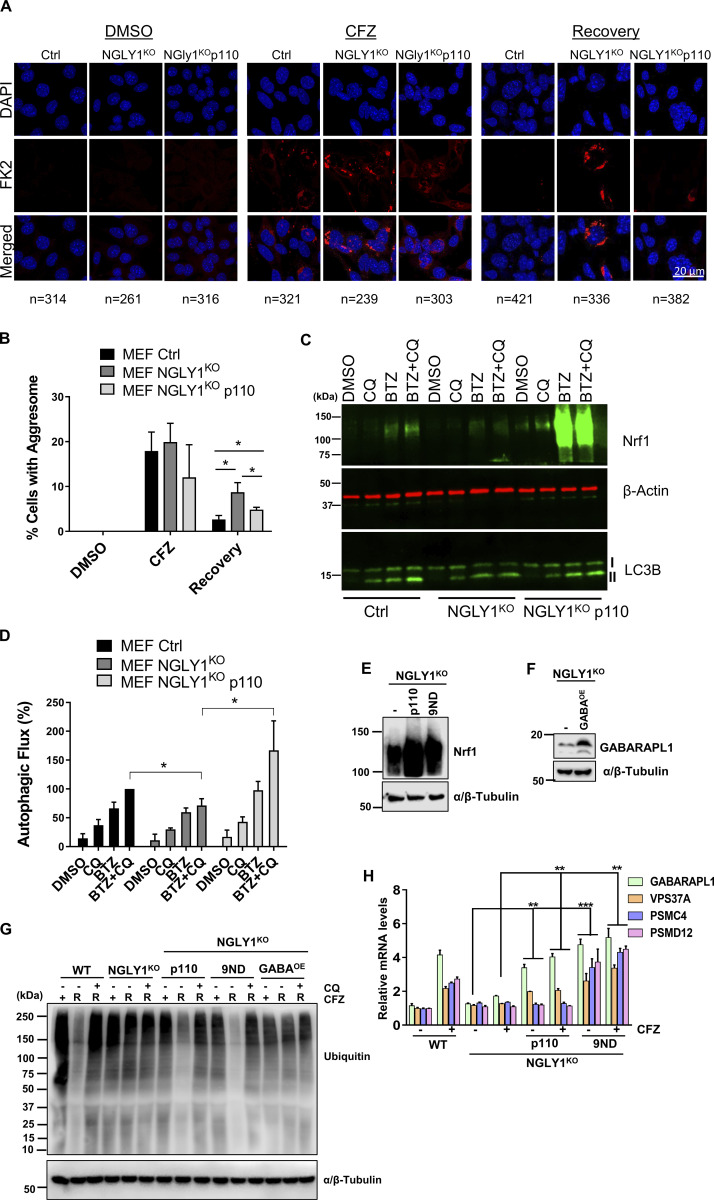
Figure 8.
Deficiency of NGLY1 causes inhibition of compensatory autophagy and aggrephagy, which can be rescued by transcriptionally active Nrf1. (A) Confocal images of FK2 labeled MEF ctrl, NGLY1KO, and NGLY1KO p110 cells after treating them with DMSO or 25 nM CFZ for 20 h. Recovery samples were washed out after CFZ treatment and incubated in fresh complete media for 20 h. Scale bar represents 20 μm. (B) Analysis of the percentage of cells with aggresomes under each condition from (5A) are plotted, based on the confocal microscopy analysis. Number of cells analyzed in each sample is noted underneath the images in B. (C) Western blot analysis of LC3B, and Nrf1 in MEF-ctrl, NGLY1KO, and NGLY1KO cells expressing p110 construct treated with DMSO, 200 nM BTZ (20 h), 60 μM CQ (3 h) or both BTZ (20 h) and CQ (3 h). β-Actin was used as a loading control. (D) Percent autophagic flux after normalizing LC3B-II levels to β-Actin levels from 8C. (E) Confirmation Western blot for Nrf1 protein expression in MEF NGLY1KO, NGLY1KO p110 overexpression, and NGLY1KO 9ND overexpression cells treated with CFZ (200 nM/4 h). α/β-Tubulin was used as the loading control. (F) Confirmation Western blot for GABARAPL1 protein expression in MEF NGLY1KO, and NGLY1KO GABARAPL1 over expression cells (GABAOE) cells. α/β-Tubulin was used for loading control. (G) MEF control (WT), NGLY1KO, NGLY1KO p110, and NGLY1KO 9ND cells were treated with 50 nM CFZ for 20 h, then washed and either treated with 60 μM CQ or fresh complete media for a 20 h recovery (R). Western blot analysis of ubiquitin after treatment and recovery, α/β-Tubulin was used for loading control. (H) MEF control (WT), NGLY1KO, NGLY1KO p110, and NGLY1KO p110-9ND cells were treated with 200 nM CFZ for 20 h. qRT-PCR analysis of ATG4A, GABARAPL1, CTSD, VPS37A, PSMD12, and PSMC4, mRNA levels were normalized to 18s rRNA. (n = 3 biological replicates). Error bars denote mean ± SD. Three biological replicates for qRT-PCR, microscopy and Western blotting were used. P values were calculated by either Student’s t test or two-way ANOVA. *<0.05, **<0.005, ***<0.0005 Source data are available for this figure: SourceData F8.

