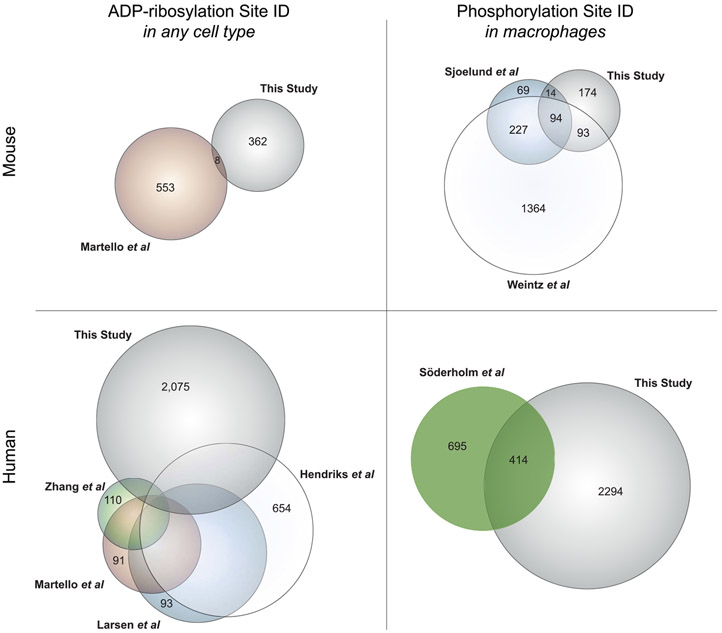
Figure 6.
Overlap between protein ADP-ribosylation and phosphorylation databases presented in this study and other available databases. Protein lists, as designated by their universal gene symbols, were generated from PTM databases presented in this study or other studies, as noted: Martello et al.,45 wherein ADP-ribosylation sites were identified from mouse liver; Zhang et al.,46 in which human HCT116 cells were analyzed for protein ADP-ribosylation following PARG knockdown; Martello et al.,45 Larsen et al.,47 and Hendriks et al.,48 in which human HeLa cells were analyzed for ADP-ribosylation sites; Sjoelund et al.,51 wherein phosphorylation sites were quantified in murine immortalized macrophages; Weintz et al.,50 in which phosphorylation was measured in murine bone-marrow-derived macrophages; and Söderholm et al.,52 wherein phosphorylation was analyzed in human blood monocyte-derived macrophages infected with influenza A. Area-proportional Euler diagrams were generated using VennMaster.60 Full overlap data for the human ADP-ribosylome is visualized in Figure S19.

