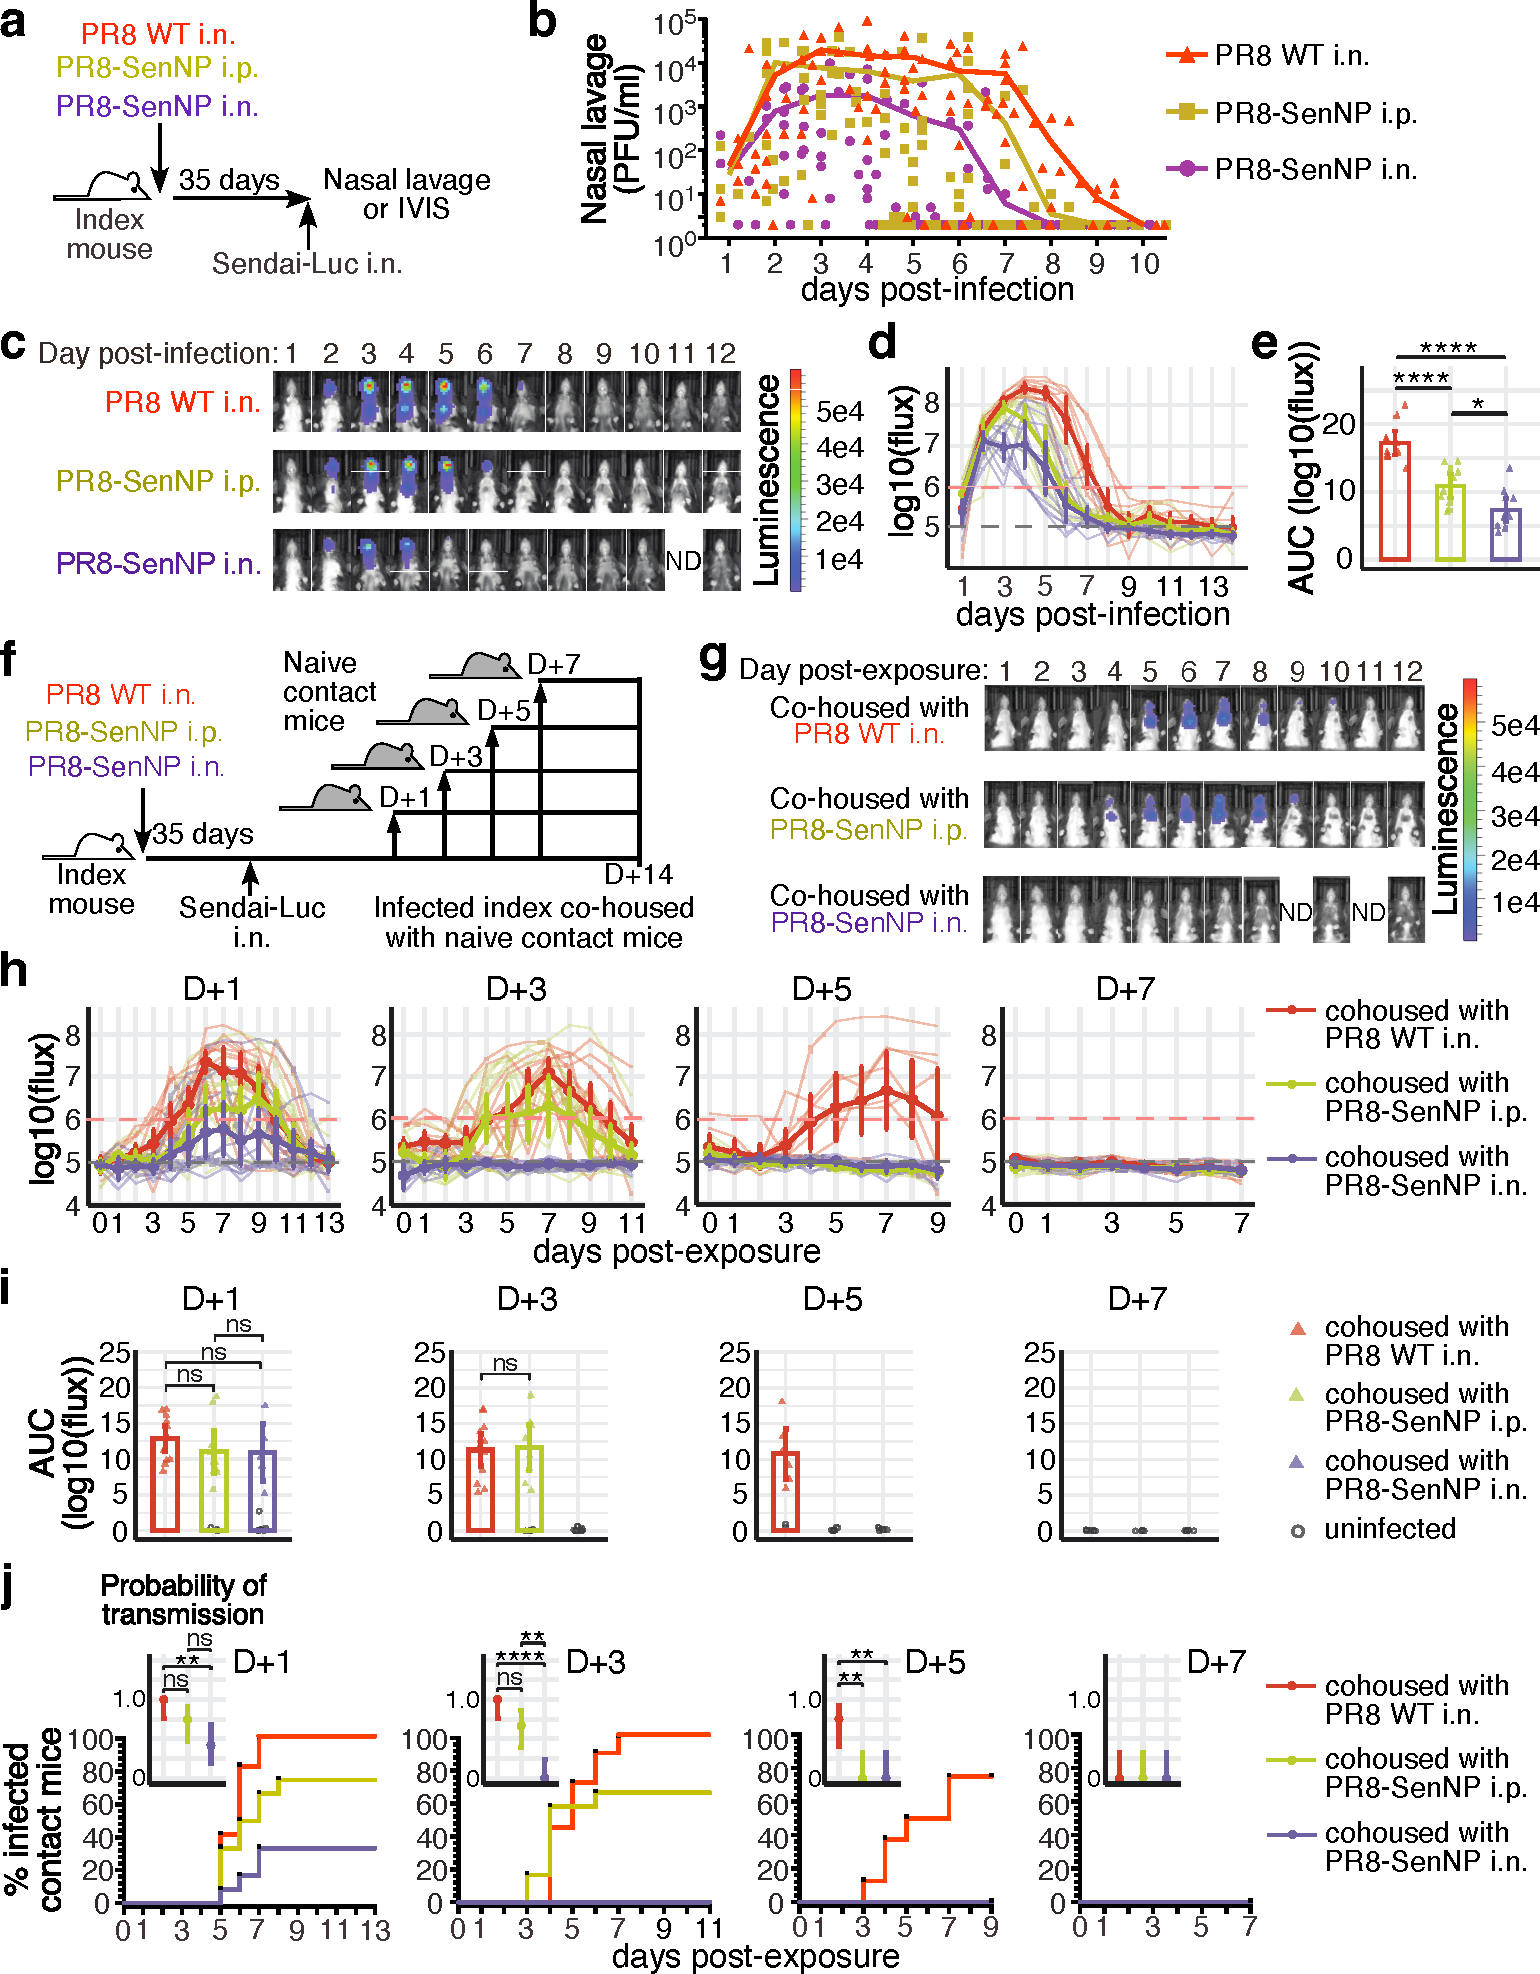
Fig. 1. Respiratory tract CD8 TRM can limit transmission of respiratory viruses.

(a) Schematic of experiment to assess Sendai viral titers in the nasal cavity of immunized mice and investigate immunization route on protection from direct infection. (b) Sendai virus titers in the nasal cavity of immunized mice (n=10 for PR8 WT n=10 for PR8-SenNP i.p., n=9 for PR8-SenNP i.n.). c) Representative in vivo imaging (IVIS) images of immunized mice following direct infection with Sendai-Luc. (d) Bioluminescence curves over the course of infection (n=10 per group). (e) Area under curve (AUC) of bioluminescence signal over the course of infection (n=10 for each experimental group). (f) Schematic of experiment to investigate transmission from immunized index mice to naïve contact mice at indicated time points. (g) Example images of contact mice where index mice were added 3 days post infection. (h) Bioluminescence curves of contact mice following co-housing on day 1 (n=12 per group), day 3 (n=12 per group), day 5 (n=8 per group), and day 7 (n=8 per group) post infection of index mice. (i) AUC of bioluminescence of contact mice that become infected following co-housing with an infected index mouse. Grey circles represent uninfected mice. (j) Percent infected contact mice following co-housing with an infected index mouse and the probability of transmission (inset). Dots represent proportion of contact mice that become infected and error bars represent 95% binomial confidence intervals. All data are representative of 2 combined experiments with similar results. For bioluminescence curves (d, h), solid dark lines represent means, solid pale lines represent individual mice, dashed grey line represents background bioluminescence, and dashed red line represents the limit of infection. Solid lines (b, e, i, j) and error bars (d, e, h, i) represent mean with 95% confidence interval. Statistical significance was determined using a two-sided Mann Whitney test. * p<0.05, ** p<0.01, *** p<0.001, **** p<0.0001, ns: non-significant.
