
Extended data Fig. 6. Sendai-specific TRM numbers and assessment of transmission under different immunization strategies at 1- and 6-months post-immunization.
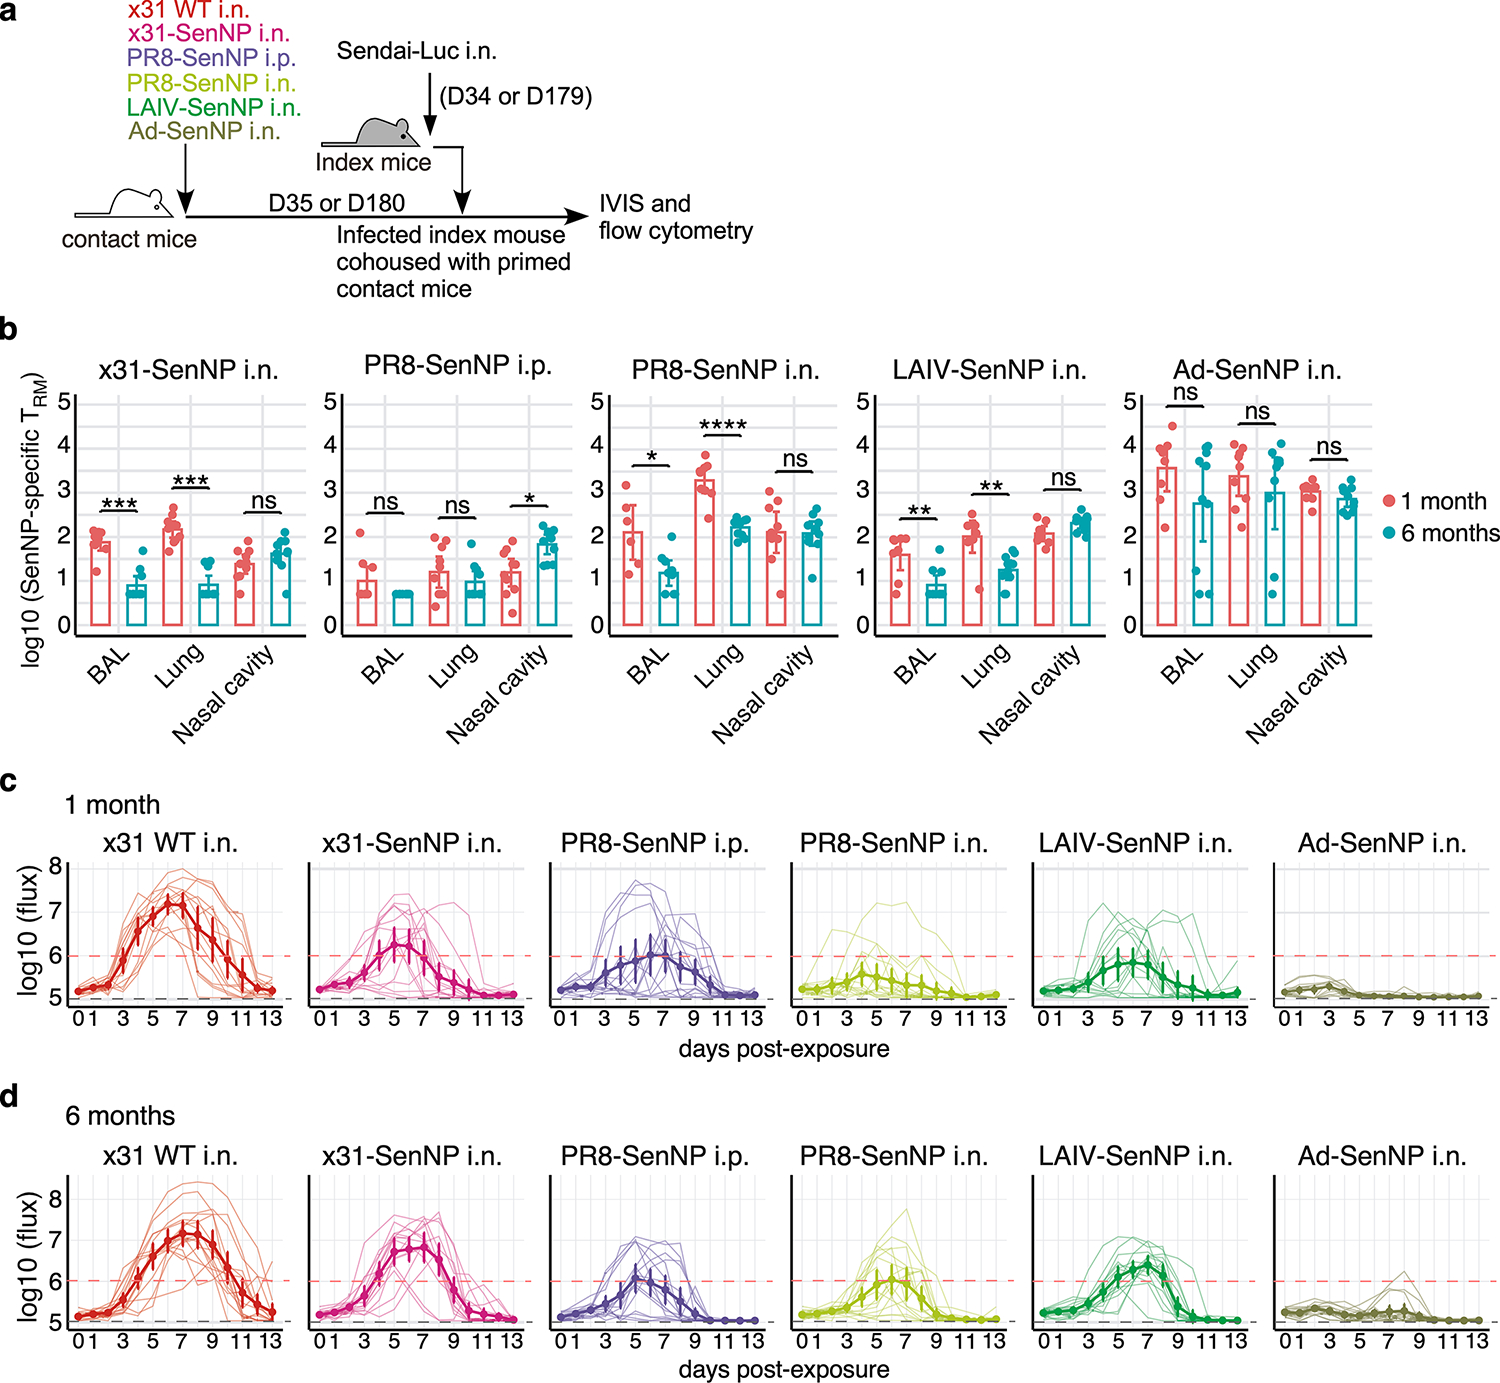
(a) Experimental schematic where contact mice, immunized as indicated, were cohoused with a Sendai-Luc infected index mouse at 35- or 180-days post-immunization. (b) Number of CD69+CD103+ Sendai NP324–332/Kb+ CD8 TRM in the BAL, lung, and nasal cavity at 1 month or six months post-immunization with x31-SenNP i.n. (n=10 per timepoint except n=9 for 1 month BAL), PR8-SenNP i.p. (n=10 per timepoint except n=9 for 1 month BAL), PR8-SenNP i.n. (1 month n=9 for lung and nasal cavity and n=6 for BAL, 6 month n=10 for lung and nasal cavity and n=9 for BAL), LAIV-SenNP i.n. (1 month n=8, 6 month n=10), and Ad-SenNP i.n. (1 month n=9 for lung and nasal cavity and n=8 for BAL, 6 month n=10 for nasal cavity and BAL, n=9 for lung). (c and d) Bioluminescence curves of immunized contact mice following exposure to an infected index mouse at 1 month (c) or 6 months (d) post-immunization with x31 WT (1 month n=14, 6 month n=16), x31-SenNP (1 month n=16, 6 month n=15), PR8-SenNP i.p. (1 month n=16, 6 month n=16), PR8-SenNP i.n. (1 month n=16, 6 month n=16), LAIV-SenNP i.n. (1 month n=15, 6 month n=16), and Ad-SenNP i.n. (1 month n=15, 6 month n=16). Solid dark lines represent means, solid pale lines represent individual mice, dashed grey line represents background bioluminescence, and dashed red line represents the limit of infection (c, d). Solid lines (b) and error bars (b-d) represent mean with 95% confidence interval. Statistical significance was determined using two-sided Mann Whitney test. Data are combined from two independent experiments. * p<0.05, ** p<0.01, *** p<0.001, **** p<0.0001, ns: non-significant.