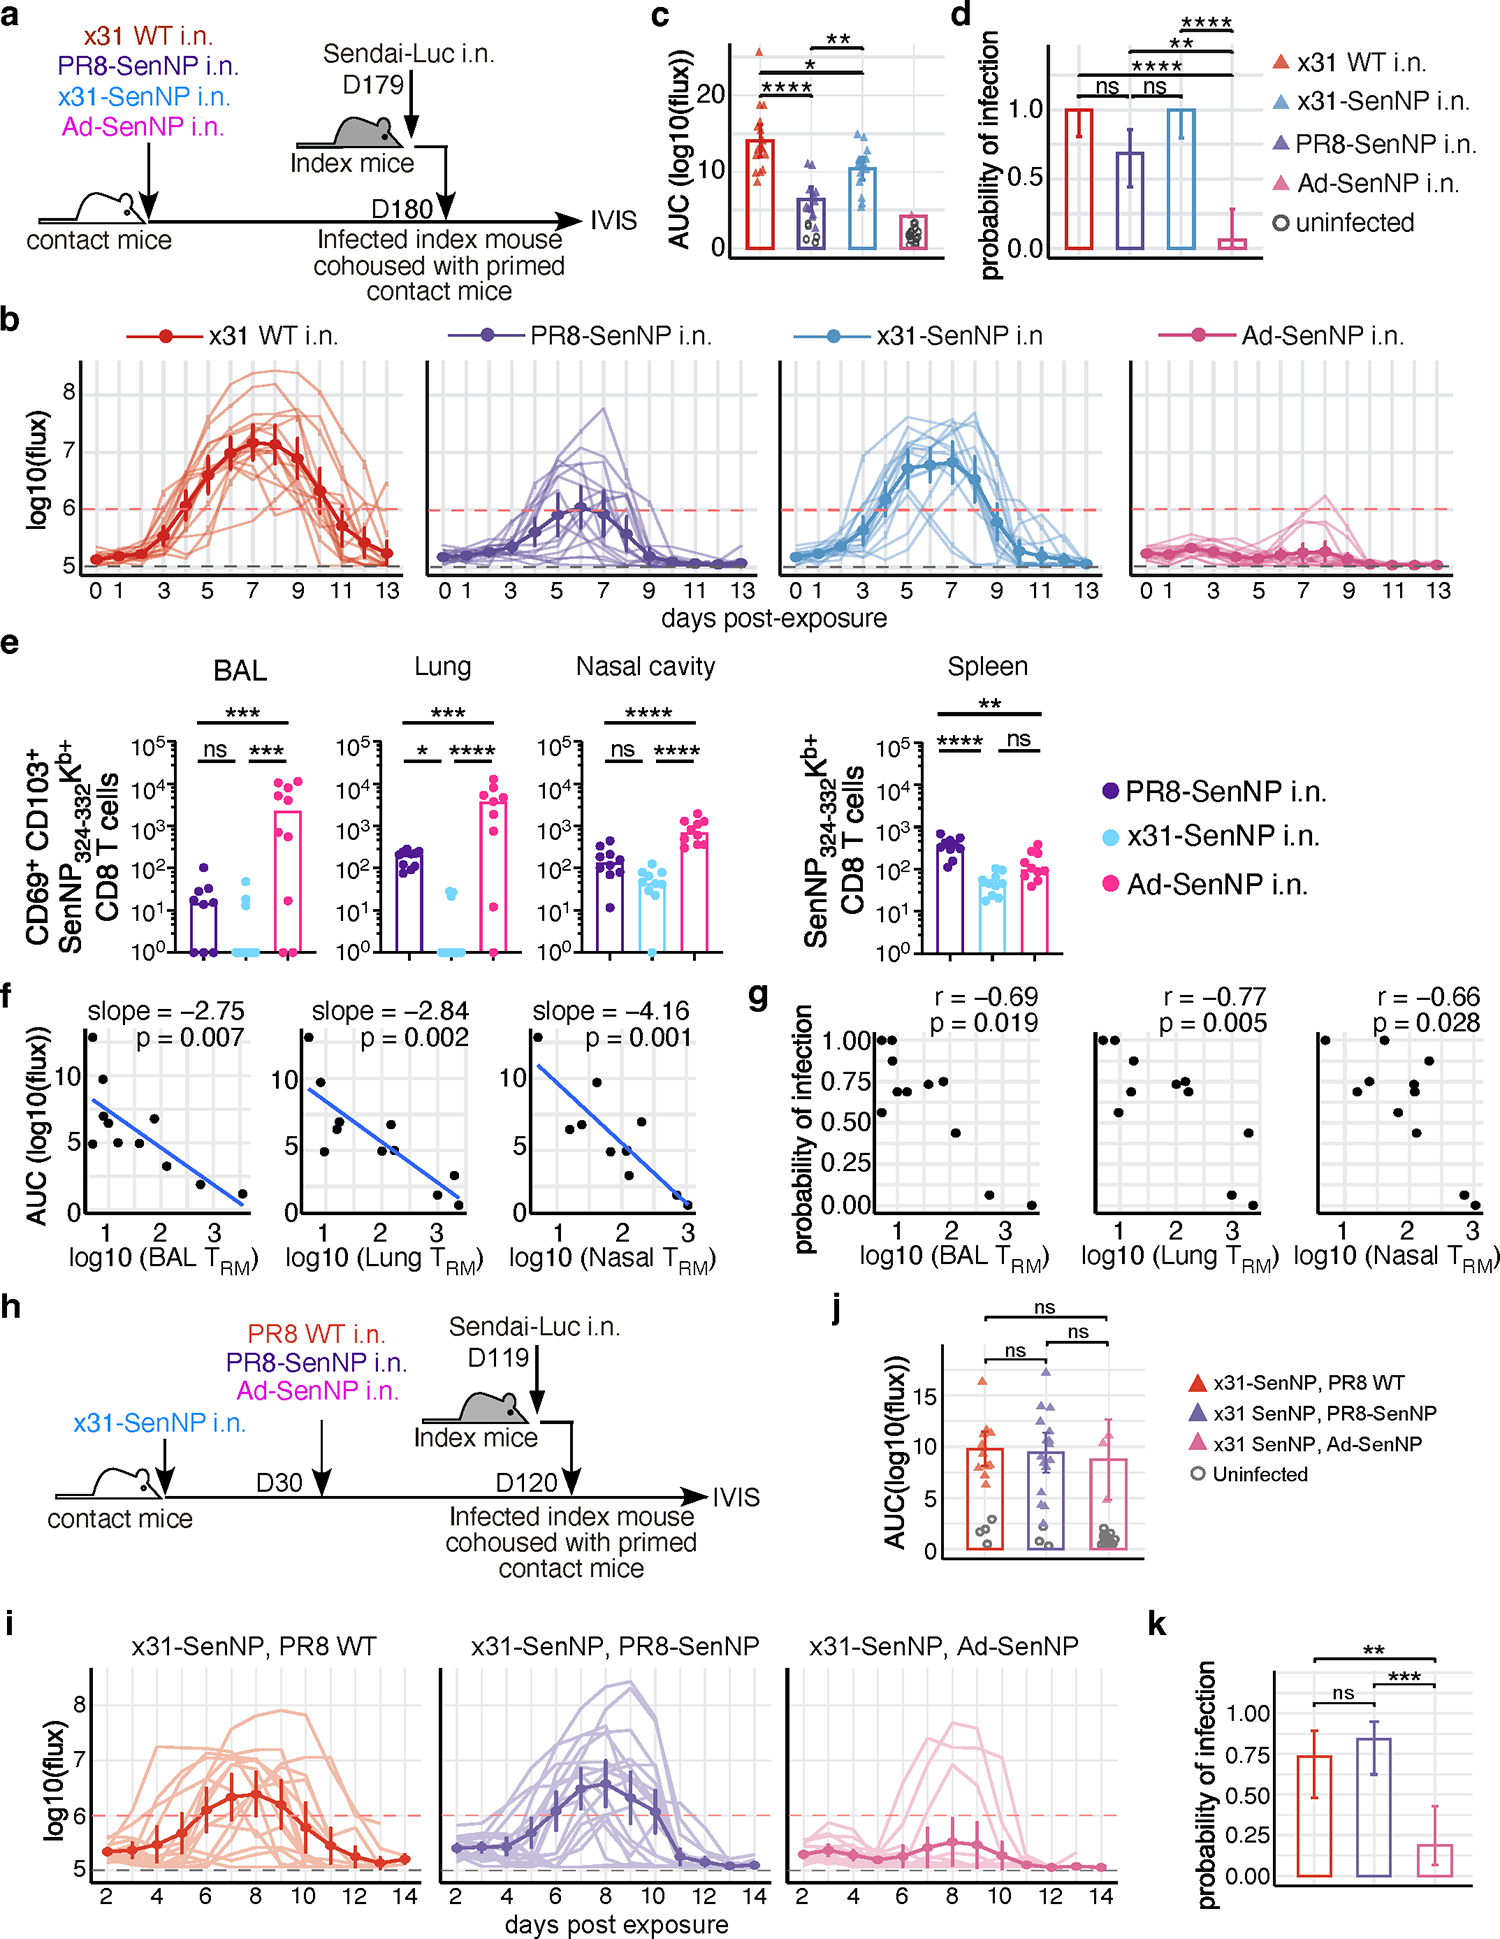
Fig. 5. The number of respiratory tract CD8 TRM is strongly linked to protection from transmission.

(a) Schematic of experiment to investigate the durability of TRM-mediated protection and ability to limit viral transmission. (b) Bioluminescence curves of contact mice immunized with x31 WT (n=16), PR8-SenNP (n=16), x31-SenNP (n=15), and Ad-SenNP (n=16) after co-housing with an infected index mouse. (c) AUC of bioluminescence in contact mice that become infected following co-housing with an infected index mouse. (d) Probability of infection for immunized contact mice, calculated as proportion of contact mice that become infected. (e) Number of CD69+CD103+ Sendai NP324–332/Kb+ CD8 TRM in the BAL (n=9 for PR8-SenNP, n=10 for x31-SenNP and Ad-SenNP), lung (n=9 for Ad-SenNP, n=10 for PR8-SenNP and x31-SenNP), and nasal cavity (n=10 per group), and Sendai NP324–332/Kb+ CD8 TEM in the spleen (n=10 per group), on D180 post-immunization. (f) Correlation between AUC of bioluminescence and the number of CD69+CD103+ Sendai NP324–332/Kb+ TRM in the BAL, lung, and nasal cavity. (g) Correlation between the probability of infection and number of CD69+CD103+ Sendai NP324–332/Kb+ TRM in the BAL, lung, and nasal cavity. (h) Schematic of experiment to investigate the impact of multiple immunizations on the durability of TRM-mediated protection against Sendai virus transmission. (i) Bioluminescence curves of immunized contact mice after co-housing with an infected index mouse (n=15 for PR8 WT boosted contacts, n=19 for PR8-SenNP boosted contacts, and n=16 for Ad-SenNP boosted contacts). (j) AUC of bioluminescence in primed and boosted contact mice that become infected following co-housing with an infected index mouse. (k) Probability of infection for immunized contact mice. Error bars represent 95% binomial proportion confidence intervals (d, k). All data are combined from 2 independent experiments. For bioluminescence curves (b, i), solid dark lines represent means, solid pale lines represent individual mice, dashed grey line represents background bioluminescence, and dashed red line represents the limit of infection. Solid lines (c, d, e, j, k) and error bars (b, c, i, j) represent mean with 95% confidence interval. Statistical significance was determined using two-sided Mann Whitney test * p<0.05, ** p<0.01, *** p<0.001, **** p<0.0001, ns: non-significant.
