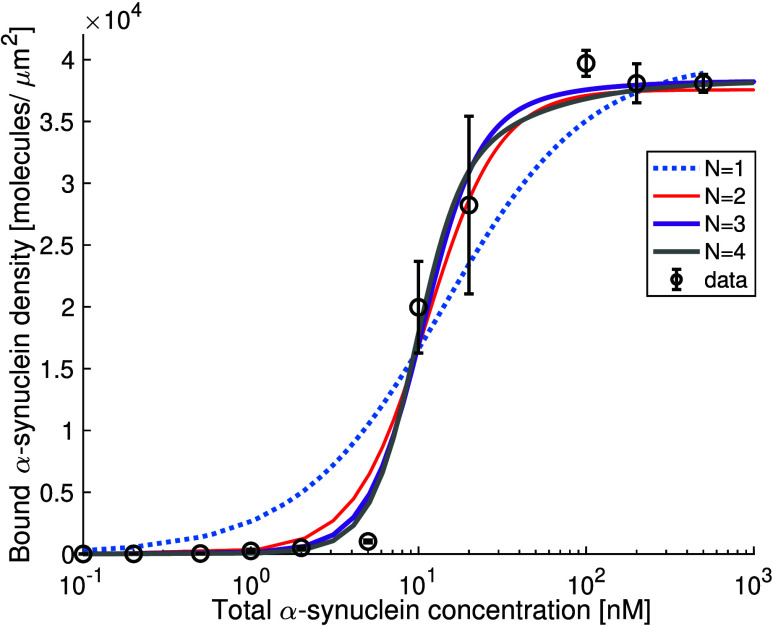
Figure 4.
Density of α-synuclein bound to a supported lipid bilayer measured with a Total Internal Reflection Fluorescence (TIRF) Microscopy. The dotted blue line shows a fit to the Adair eqaution47 assuming one binding site, which corresponds to independent binding. The red, purple, and gray lines show fits to Adair equations assuming two, tree, and four coupled binding sites, respectively. N is the number of coupled binding sites. Reproduced from ref (43). Copyright 2021 American Chemical Society.

