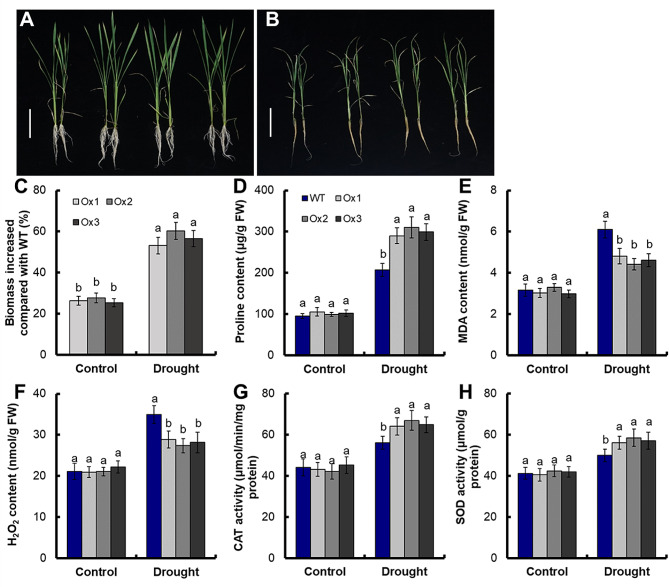
Fig. 2.
Physiological and biochemical changes at the seedling stage. Rice seedlings were grown with the normal IRRI solution for 2 weeks and then transferred to nutrient solution supplemented with 15% (w/v) PEG6000 for 2 weeks. Phenotype of transgenic lines grown in (A) control and (B) drought stress (15% PEG6000) conditions. Bar = 10 cm. (C) Increased biomass in transgenic plants relative to WT. (D) Proline content, (E) MDA content, (F) H2O2 content, (G) CAT activity and (H) SOD activity. Error bars: SE (n = 5). The different letters indicate a significant difference between the transgenic line and the WT (P < 0.05, one-way ANOVA, least significance difference model)

