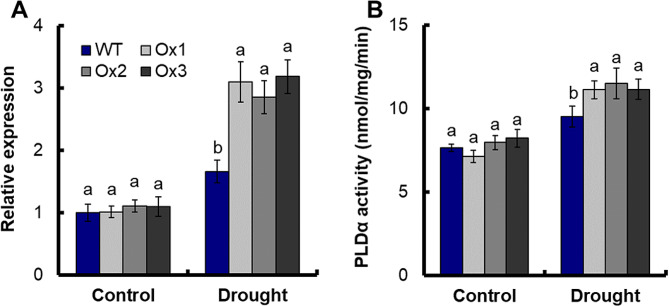
Fig. 6.
PLDα activity of WT and transgenic under drought stress conditions. Growth conditions and treatments were the same as described in Fig. 3. Samples from root of seedlings under control and drought stress (15% PEG6000) conditions. (A) Expression of OsPLDα1 in the transgenic lines under drought stress conditions. Error bars: SE (n = 3). (B) PLDα activity of WT and transgenic under drought stress conditions. Error bars: SE (n = 5). The different letters indicate a significant difference between the transgenic line and the WT (P < 0.05, one-way ANOVA, least significance difference model)

