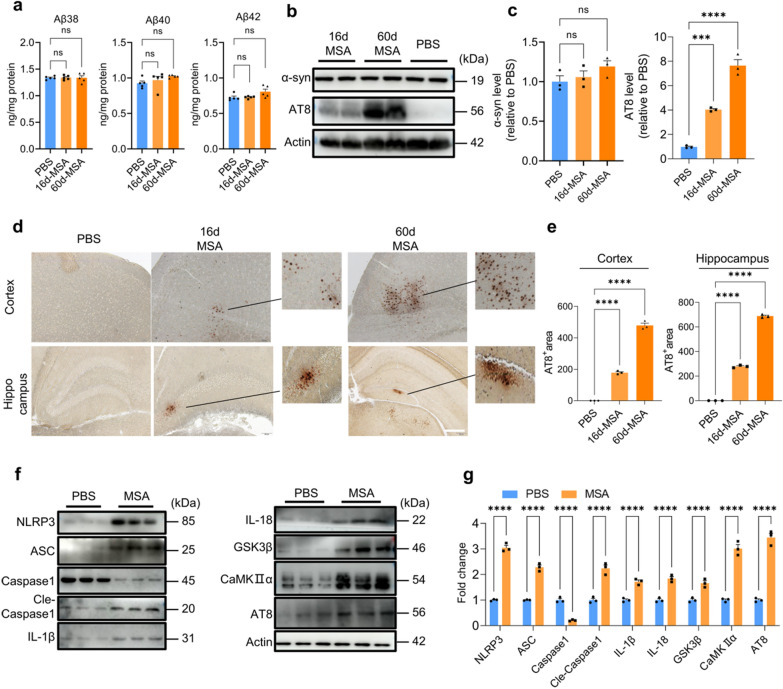
Fig. 3.
MSA induces tau phosphorylation in mouse brains. a Aβ levels in the brains of mice treated with or without MSA detected by MSD. n = 5, representing three independent experiments, data are mean ± SEM. One-way ANOVA with Tukey’s multiple comparisons test for multiple groups was used for statistical analysis. b, The levels of tau phosphorylation and α-synuclein in the mouse brains treated with or without MSA detected by WB. c, Quantification of the WB result in b by Image J. d, The tau phosphorylation in cortex and hippocampus of the mouse brains detected by IHC staining (scale bar, 200 μm). e, Quantification of AT8 staining in d by Image J. For c, e, n = 3, representing three independent experiments, data are mean ± SEM. One-way ANOVA with Tukey’s multiple comparisons test for multiple groups was used for statistical analysis. f, The levels of key proteins involved in the pathway of tau phosphorylation in mouse brains detected by WB. g, Quantitative analysis of the WB bands in f using Image J analysis software. n = 3, representing three independent experiments, data are mean ± SEM, and Student’s test was used for statistical analysis. ns, no significance; *p < 0.05, **p < 0.01, ***p < 0.001and ****p < 0.0001

