Fig. 5.
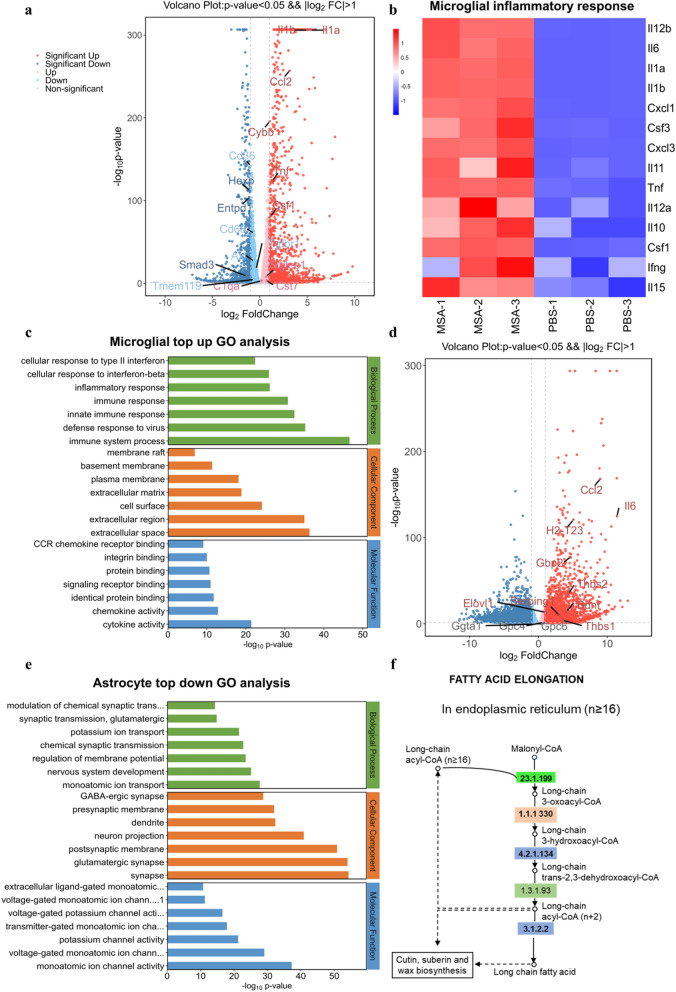
Transcriptome signature of microglia and astrocytes isolated from mice treated with or without MSA. a Volcano plot based on differentially expressed genes in the microglia of mice treated with or without MSA. b Heatmap showing expression changes in microglial inflammation-related genes in the mice treated with or without MSA. (MSA1-3: microglia isolated from MSA-treated mice, PBS1-3: microglia isolated from PBS-treated mice). c GO term analysis showing the most significant upregulated pathway in the microglia of mice treated with or without MSA. d Volcano plot based on differentially expressed genes in the astrocytes of mice treated with or without MSA. e GO term analysis showing the most significant downregulated pathway in the astrocytes of mice treated with or without MSA. f KEGG map showing significantly upregulated fatty acid elongation pathway in the astrocytes of mice treated with or without MSA

