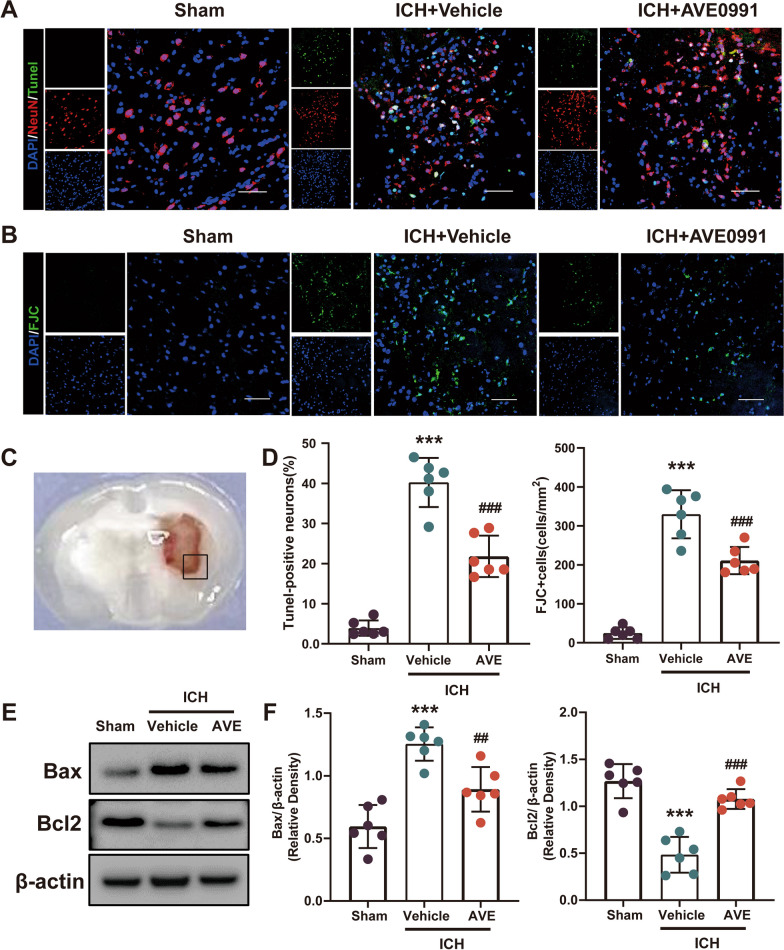
Fig. 4.
Effects of Mas activation with AVE0991on neuronal apoptosis and neuronal apoptotic molecular markers after ICH. A, B Representative images of the co-localization of TUNEL (green) with neurons (NeuN, red) and FJC (green) staining in the perihematomal area at 3 days after ICH. Scale bar = 50 μm. C Regions of interest areas in the perihematomal region. D Quantitative analyses of TUNEL and FJC-positive cells in the perihematomal area at 3 days after ICH (n = 6/group). E, F Representative western blot bands and quantitative analyses of Bax and Bcl-2 protein levels at 3 days after ICH. Data was represented as mean ± SD. ***P < 0.001 vs. Sham; ##P < 0.01, ###P < 0.001 vs. ICH + Vehicle, n = 6/group

