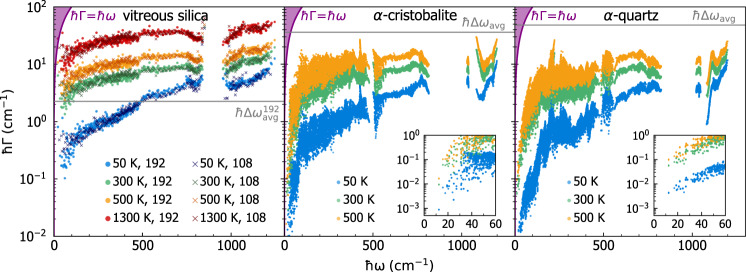
Fig. 10. Effect of disorder and temperature on the linewidths of silica polymorphs.
Increasing temperature yields an increase of the linewidths that account for third-order anharmonicity88,89 and isotopic-mass disorder92 in both vitreous and crystalline materials: the left panel shows the 192(D) and 108(D) vitreous-silica model (both computed from first-principles and at q = 0 only), the central panel shows α-cristobalite, and the right panel shows α-quartz. The temperatures of 50, 300, and 500 K at which the linewidths distributions are reported are chosen to span the temperature range over which all these materials are stable. The 1300 K distribution shows the behavior at high temperature, and is reported only for vitreous silica since α-cristobalite and α-quartz are not stable at this temperature. The insets in the central and right panels show the linewidths at low vibrational energies for α-cristobalite and α-quartz, respectively. The purple area shows the overdamped regime characterized by ℏΓ > ℏω; the lack of linewidths in the purple region shows that there are no overdamped vibrations and thus the Wigner formulation can be employed41,47. The gray lines represent the average spacing between the vibrational energy levels Eq. (6) (in the left panel only the average energy-level spacing for the 192-atom model is reported).

