
Fig. 11. Effect of q interpolation on the linewidths and approximation to reduce the computational cost.
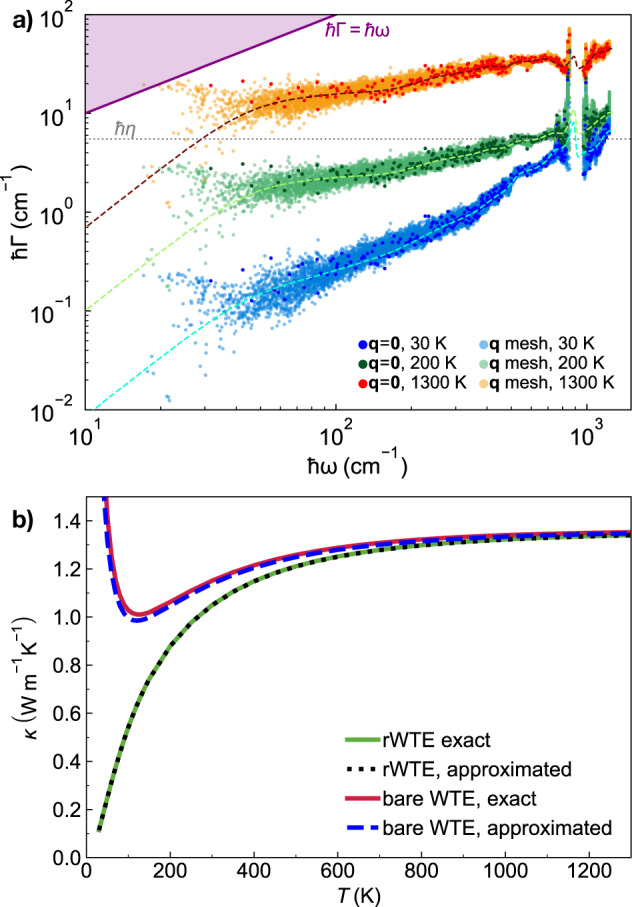
a Linewidths of the 108(D) model of v-SiO2 computed explicitly on a 5 × 5 × 5 q mesh (light blue is at 30 K, light green is at 200 K, and orange is at 1300 K) or computed at the point q = 0 only (dark blue is at 30 K, dark green is at 200 K, and red is at 1300 K). The purple region represents the overdamped regime, where vibrations cannot be accurately described using the Wigner formulation and spectral-function approaches have to be employed41,47. The horizontal dotted line is the broadening ℏη used in the Voigt renormalization for the 108-atom model, all the linewidths below this line are regularized and thus have negligible effect on the rWTE conductivity. The dashed lines are the analytical functions Γa[ω], determined from the distributions at q = 0 only as detailed in Eqs. (10), (11). b Shows the bare WTE conductivity of the 108(D) model computed exactly (i.e., using the linewidths explicitly computed on the 5 × 5 × 5 q mesh, solid red), or using the linewidths approximatively determined using the function Γa[ω] (dashed blue); the solid green and dotted black lines show the rWTE conductivities computed using the exact or approximated linewidths, respectively.