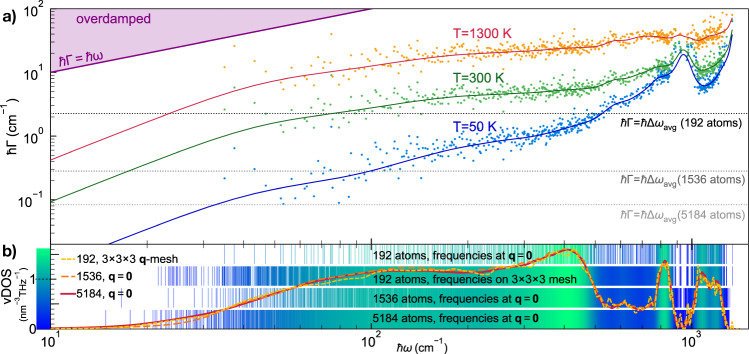
Fig. 3. Vibrational frequencies and anharmonic linewidths of v-SiO2.
a The scatter points are the linewidths as a function of frequency and temperature for the 192-atom model; these are computed at q = 0 only accounting for third-order anharmonicity87–91 and natural-abundance isotopic mass disorder92. The solid lines represent a coarse graining of the frequency-linewidth distribution into a single-valued function51,93 Γa[ω] (see Methods). The horizontal lines show the average energy-level spacing for the 192-atom (black), 1536-atom (dark gray), and 5184-atom (light gray) models; for each model all the vibrations with linewidth around and below the corresponding average energy-level spacing line are not accurately accounted for by the bare WTE (Eq. (1) and (4)), and need to be regularized (see text). b The solid red line is the vibrational density of state (vDOS) of the 5184-atom model computed at q = 0. The dashed yellow (orange) line is the vDOS of the 192-atom model computed using a 3 × 3 × 3 q mesh (1536-atom model computed at q = 0). The vertical lines show how the vibrations of v − SiO2 are sampled using the 192-atom model at q = 0 only (first row, corresponding to the abscissas of the scatter points in a)), using the 192-atom model and relying on q interpolation on a 3 × 3 × 3 mesh (second row), using the 1536-atom model at q = 0 only (third row), and using the 5184-atom model at q = 0 only (last row).

