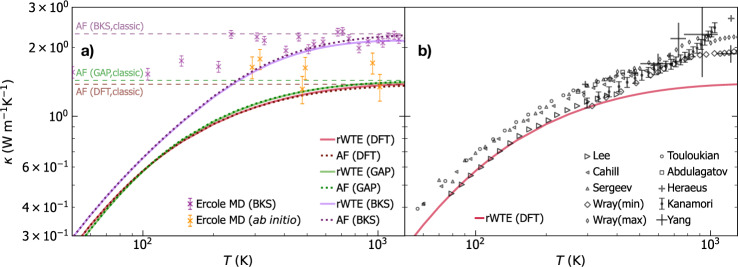
Fig. 5. Thermal conductivity of v-SiO2: theory vs experiments.
a Solid (dotted) lines are the rWTE (AF) conductivities for a 192-atom (`192(D)') model of v-SiO2 generated using first-principles techniques65, repeated periodically 3 × 3 × 3 times and studied using first-principles DFT calculations (red), a GAP potential (green), or the BKS potential (purple). The dashed lines are the classical AF conductivities (same color code), corresponding to vibrational modes having specific heat always equal to kB39. Cyan and purple scatter points are predictions from first-principles and classical (BKS-based) molecular dynamics simulations, respectively, from Ercole et al.26. These MD calculations are governed by classical equipartition39 and generally agree with the corresponding classical AF conductivities (the increasingly larger differences between MD and classical AF observed lowering temperature may be due to the decrease of the accuracy with which atomic vibrations are sampled in MD simulations when temperature is lowered). Importantly, in the high-temperature limit, when the correct quantum Bose-Einstein statistics of vibrations yields a specific heat approaching the classical limit, the MD calculations are in good agreement with the corresponding (first-principles- or BKS-based) rWTE predictions. b Scatter points are experiments from Wray et al.143, Kanamori et al.107, Touloukian et al.144, Sergeev et al.145, Cahill146, Lee and Cahill (190 nm sample)147, Abdulagatov et al.148, Yang et al.106, and Heraeus139. The red line is the (most accurate) first-principles rWTE conductivity, which is in agreement with experiments at temperatures where radiative effects are negligible (T ≲ 450 K).

