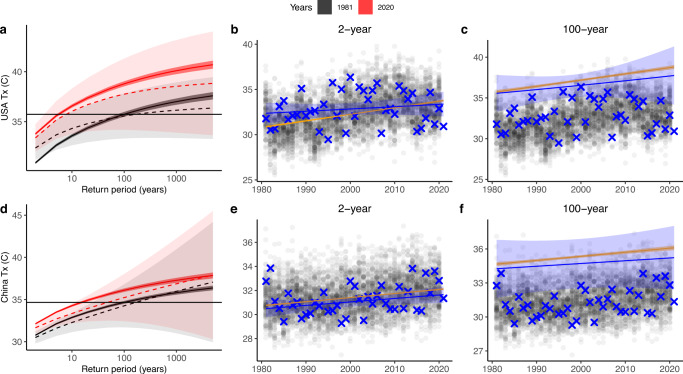
Fig. 3. Extreme value distributions for daily maximum temperatures.
Temperatures are in March–May for the US midwest (top row) and northeast China (bottom row). a, d Return period of seasonal maximum temperatures in 1981 and 2020. GEV fits are plotted for observations using dotted lines and light shading to indicate the uncertainty estimates. GEV fits are plotted for the UNSEEN ensemble using solid lines and dark shading for uncertainty estimates. All GEV fits are non-stationary distributions with covariates for the years 1981 and 2020. The magnitude of the 100-year event is indicated with a black horizontal line. b, e UNSEEN ensemble in gray overlaid with observations in blue, with a non-stationary 2-year return period estimation for each dataset. c, f UNSEEN ensemble in gray overlaid with observations in blue, with a non-stationary 100-year return period estimation for each dataset. The 95th percentile confidence interval is plotted using shading for the observations in blue. Statistical uncertainty is estimated as 95% confidence intervals based on the normal approximation.

