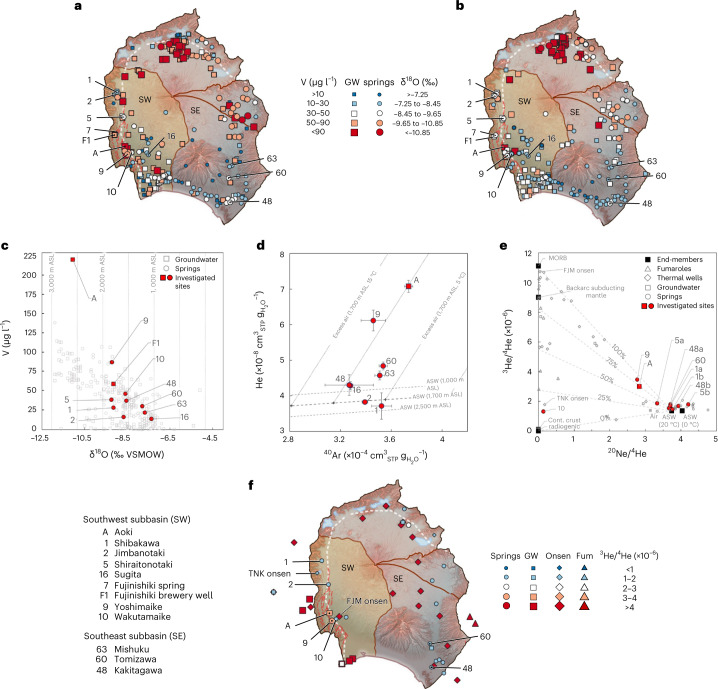
Fig. 3. Overview of V, δ18O and He compositions in springs and groundwater of Fuji catchment.
a,b, Maps of V (a) and δ18O (b) compositions. c, δ18O versus V concentrations. Hypothetical recharge elevations (from δ18O after Yasuhara et al.36) are indicated by dotted vertical lines assuming no mixing of waters from different elevations. d, Average He and 40Ar concentrations measured on site with the new portable GE-MIMS instrument133. The black dashed lines represent air-saturated water (ASW) for 20 °C at the three primary recharge elevations after Yasuhara et al.36 for the southwestern basin. The dotted lines indicate hypothetical excess air additions to ASW at 1,700 m ASL and for 0 °C, 5 °C, 10 °C and 15 °C. Error bars indicate ±1 s.d. of the mean of all GE-MIMS measurements taken at each site. The numbers of sampling dates used to quantify average values and standard deviations per site are: A (n = 2), 1 (n = 1), 2 (n = 1), 9 (n = 2), 16 (n = 1), 48 (n = 2), 60 (n = 2), 63 (n = 1). GW, groundwater. e, 3He/4He versus 20Ne/4He for samples obtained in this study (sites A, 6, 9 and 10a) alongside previous measurements (sites 1a96, 1b53, 3a96, 3b53, 796 and 10b102 and data from onsen deep wells53,104,107,111, groundwater wells53 and fumaroles57) and end-member isotopic ratios55,57 (mid-ocean ridge basalt (MORB), continental crust, radiogenic production, ASW at 0 °C and ASW at 20 °C). f, Overview map of 3He/4He ratios. TNK, Lake Tanuki. FJM, Fujinomiya. Fum, Fumaroles. For all data and corresponding references, see Supplementary Data 1. Coordinate reference system: WGS 84 / Pseudo-Mercator. Background composite map sources: digital elevation model162; red 3D hillshade map163,164; active tectonic fault locations165; plate boundaries and major tectonic faults43,166,167. White dashed lines in a, b and f indicate the FKFZ and KMFZ tectonic zones; red dashed lines in a, b and f indicate active tectonic faults.

