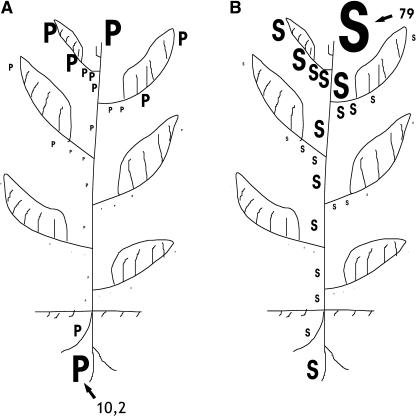
Figure 5.
PAs as signal-integrating developmental processes throughout the tobacco plant. PA synthesis is estimated from the enzyme-specific activities in the soluble fractions. Activity levels are represented by magnitude levels depicted by the sizes of letters P for Put synthesis and S for synthesis of higher PAs (Spd and Spm). A, Sites of Put synthesis. Synthesis of Put is depicted as a sum of ADC and ODC activities. B, Sites of synthesis of higher PAs. Synthesis of higher PAs is depicted as a sum of SPDS and SPMS activities. Numbers 10.2 and 79 show (with arrows) the activity levels (in nmol [of the product measured] h−1 mg−1 protein) depicted by the sizes of the biggest P and S, respectively. All the other sizes of P and S are depicted proportionally to the respective biggest ones.

