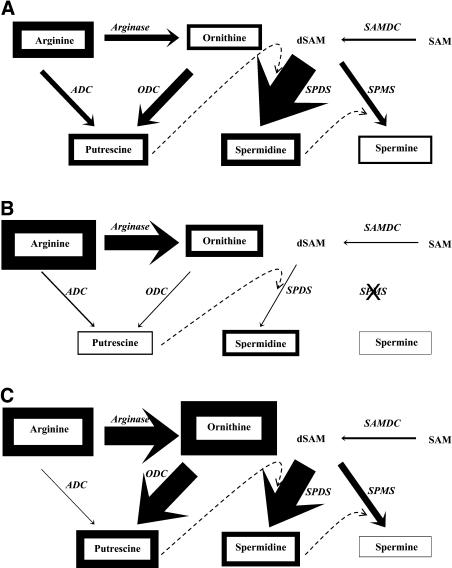
Figure 6.
The tobacco PA biosynthetic pathway in the youngest leaf (A), oldest leaf (B), and young roots (C). The endogenous contents of amino acids and free PAs are depicted by the thickness of their boxes, whereas the soluble-specific activities of the biosynthetic enzymes (in italics) are depicted by the thickness of the corresponding arrows. In the youngest leaf (A), the contents of Arg, Orn, Put, Spd, and Spm (nmol mg−1 protein), depicted by the corresponding thicknesses of boxes, are 8.6, 3.4, 6.8, 7.8, and 2.5 respectively, whereas the specific activities of ADC, ODC, SAMDC, SPDS, SPMS, and Arginase (nmol product h−1 mg−1 protein), depicted by the corresponding thicknesses of arrows, are 2.4, 4.3, 0.9, 28.1, 5.2, and 373, respectively. (For depicting reasons, thicknesses of ADC, ODC, and SAMDC are estimated 2-fold higher than thicknesses of SPDS and SPMS, whereas thicknesses of Arg are estimated 60-fold lower.) The thicknesses of boxes and arrows in B and C are depicted proportionally to the respective thicknesses in A.

