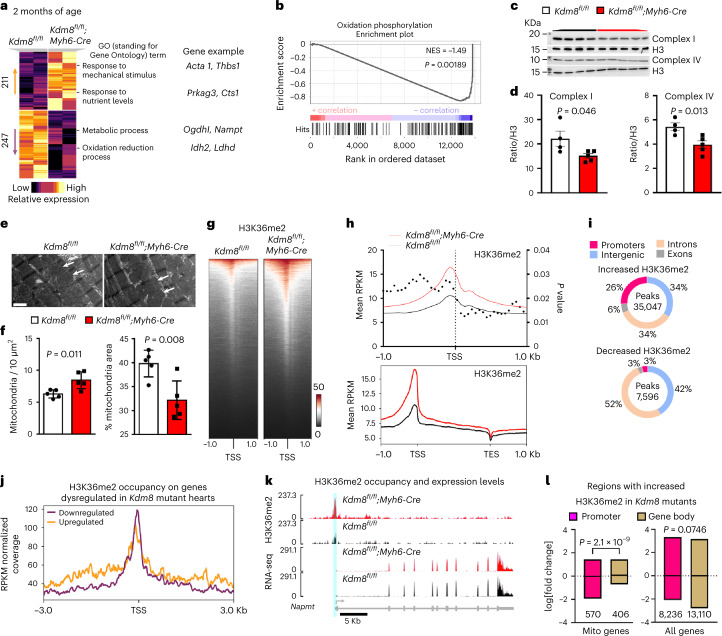
Fig. 2. Genes regulating mitochondrial oxidative metabolism are repressed before cardiac functional decline in Kdm8 mutant hearts.
a, Heatmap clustering of genes differentially expressed in ventricles of 2-month-old Kdm8fl/fl;Myh6-Cre mutant vs Kdm8fl/fl control mice. Enriched GO terms and representative genes are shown. b, GSEA including all expressed genes. P values were obtained from GSEA. NES, normalized enrichment score. c, Western blot of electron transport chain complexes I (Ndufb8) and IV (Cytochrome C) on 2-month-old ventricles. d, Protein relative to histone H3 in c. Data are mean ± s.e.m. Two-tailed Student’s t-test. n = 4 control and 5 mutant hearts. e, Transmission electron micrographs of the left ventricle of 2-month-old controls and mutants. Arrowheads indicate mitochondria. Scale bar, 1 μm. f, Mitochondria per 10 μm2, and percentage area occupied by mitochondria per micrograph. Data are mean ± s.d. Two-tailed Student’s t-test. n = 5 mice per group. g, Heatmap of H3K36me2 (red) occupancy (normalized counts) in 2-month-old control and mutant hearts 1 kb upstream and downstream of the transcription start site (TSS). h, H3K36me2 enrichment as reads per kilobase per million mapped reads (RPKM) 1 kb upstream and downstream of the TSS in 2-month-old control and mutant hearts. TES, transcription end site. Dots indicate P values. i, Peaks with increased or decreased H3K36me2 across promoters, introns, exons and intergenic regions in 2-month-old Kdm8 mutant hearts. j, H3K36me2 occupancy RPKM 3 kb upstream and downstream of the TSS of genes that were downregulated or upregulated in 2-month-old Kdm8 mutant hearts. k, H3K36me2 CUT&Tag and RNA-seq tracks of Nampt in 2-month-old control and mutant hearts. Units for CUT&Tag are RPKM and reads per million mapped reads (RPM) for RNA-seq. l, Boxplot showing the mean and range (minimum to maximum) log fold change expression of genes encoding proteins that localize to the mitochondria (sourced from MitoCarta3.0), and of all genes with increased H3K36me2 at promoters or gene bodies. Unpaired two-tailed Student’s t-test. The number of genes in each compared category is indicated below each bar.

