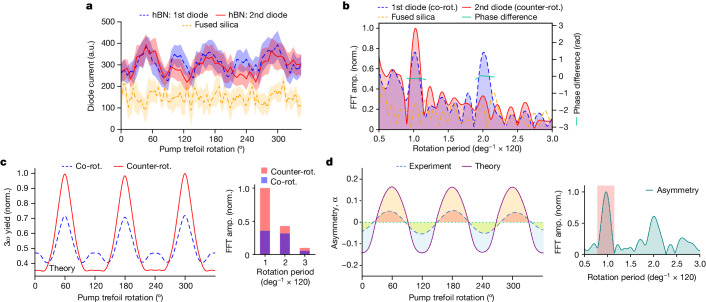
Fig. 3. Comparison between experimental and theoretical results.
a, Experimentally obtained helicity-resolved third-harmonic (3ω) yield as a function of pump trefoil rotation. The blue and red curves present data of two photodiode currents measured during the exposure of the hBN sample. Representative data for exposure of only the fused-silica substrate is represented by the yellow curve. The solid line was produced by taking the statistical mean of all the photodiode current data points recorded within a bin size of 3°. The shaded regions depict the respective standard deviations. b, Fast Fourier transform (FFT) spectra of the curves in a. Distinct peaks corresponding to a 120° periodic oscillation are present for hBN (blue and red) and absent for the substrate (yellow). The phase difference between the oscillations from the two photodiodes for hBN is represented by the green curves. c, Simulated 3ω yields corresponding to a helicity co-rotating (blue curve) and counter-rotating (red curve) with the ω field of the trefoil as a function of the pump trefoil rotation. The inset shows the FFT spectra of the curves. Calculations were performed for a pump intensity of 7 TW cm−2. d, Comparison of the asymmetries () deduced from the experimental and theoretical data. The experimental curve was obtained after Fourier filtering around the frequency corresponding to the 120° oscillation, as shown in the inset. amp., amplitude; norm., normalized; rot., rotating.

