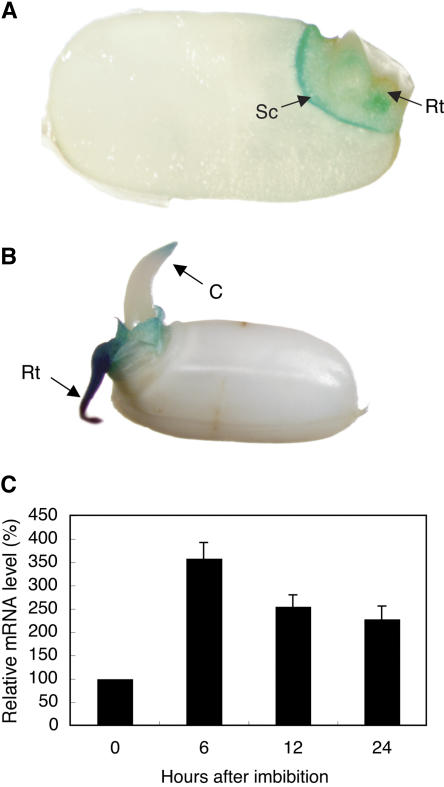
Figure 7.
Expression of the OsENT2 gene during germination. Histochemical localization of OsENT2-promoter-controlled GUS activity in seedlings at 1 d (A) and 2 d (B) after the start of imbibition. A longitudinal section of a representative grain is shown in A. C, Coleoptile; Rt, root; Sc, scutellum. Relative amount of OsENT2 mRNA during germination is shown in C. The OsENT2 mRNA level was normalized with respect to the corresponding actin transcript level. The data are given as relative values with respect to the value determined at 0 h. Data shown are means ± se (n = 3).

