Figure 8.
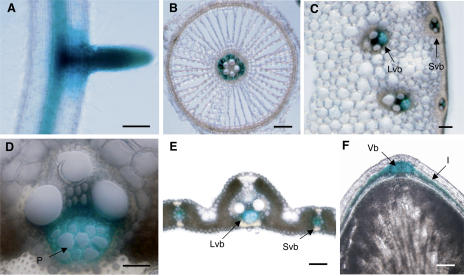
Tissue specificity of the activity of the OsENT2 promoter. Histochemical localization of OsENT2 promoter-controlled GUS activity in a representative root (A), a root cross-section (B), a stem cross-section (C), a vascular bundle in a leaf sheath (D), a leaf blade cross-section (E), and a longitudinal section of a grain (F). I, Inner integument; Lvb, large vascular bundle; P, phloem; Svb, small vascular bundle; Vb, vascular bundle on the dorsal side of grain. Bar = 500 μm for A; 100 μm for B, C, E and F; 50 μm for D.

