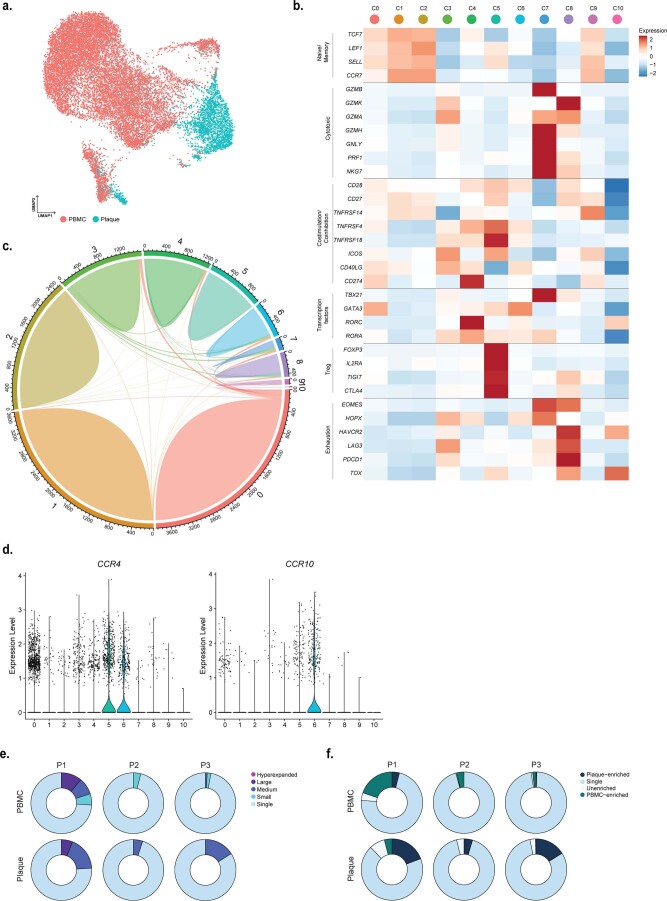
Extended Data Fig. 7. CD4+ T cell marker genes and tissue distribution.
a. UMAP visualization of tissue distribution of PBMC and plaque CD4+ T cells. b. Heatmap with expression of T cell function-associated genes in CD4+ T cell clusters. c. Circle plot visualizing the overlap of clonotypes between all CD4+ clusters. Each color represents a different cluster. Axis indicates the number of TCRs. Line thickness indicates the number of overlapping clonotypes. d. Violin plots depicting expression of CCR4 and CCR10 in CD4+ T cell clusters. e. Circle plots depicting clonal expansion levels of CD4+ T cells per tissue and per patient. f. Circle plots depicting tissue-enrichment scores of CD4+ T cells per tissue and per patient. Clonotype expansion levels: Single (one occurrence), Small (≤0.1%), Medium (>0.1 & ≤1%), Large (>1 & ≤10%), Hyperexpanded (>10%), percentage of all CD4+ T cells. Tissue enrichment scores: Plaque-enriched (Frequency expanded clone higher in Plaque vs. PBMC), Single (one occurrence), Unenriched (Frequency expanded clone similar in PBMC vs. Plaque), PBMC-enriched (Frequency expanded clone higher in PBMC vs Plaque).

