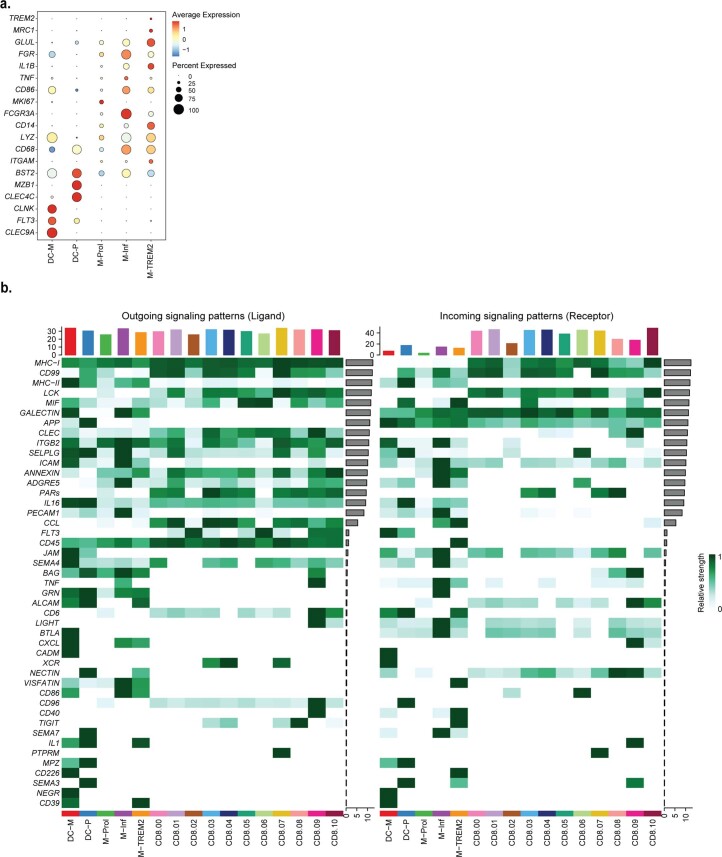
Extended Data Fig. 8. CellChat interaction pathways between CD8+ T cells and myeloid cells.
a. Dotplot displaying average expression of genes describing the different dendritic cell and macrophage clusters. DC-M indicates myeloid-derived dendritic cell (DC); DC-P indicates plasmacytoid DC; M-PROL indicates proliferating macrophages; M-Inf indicates inflammatory macrophage; M-TREM2 indicates TREM2hi macrophages. b. Heatmaps displaying outgoing (Ligand) and incoming (Receptor) signalling patterns of pathways describing potential ligand-receptor interactions. Scale above heatmap indicates the relative signalling strength of a cell cluster based on all signalling pathways displayed in the heatmap. Grey bars right of the heatmap show the total signalling strength of a pathway in all cell clusters. The relative signalling strength indicated by ranging color from white (low) to green (high). All cells included in these graphs originate from the plaque.

