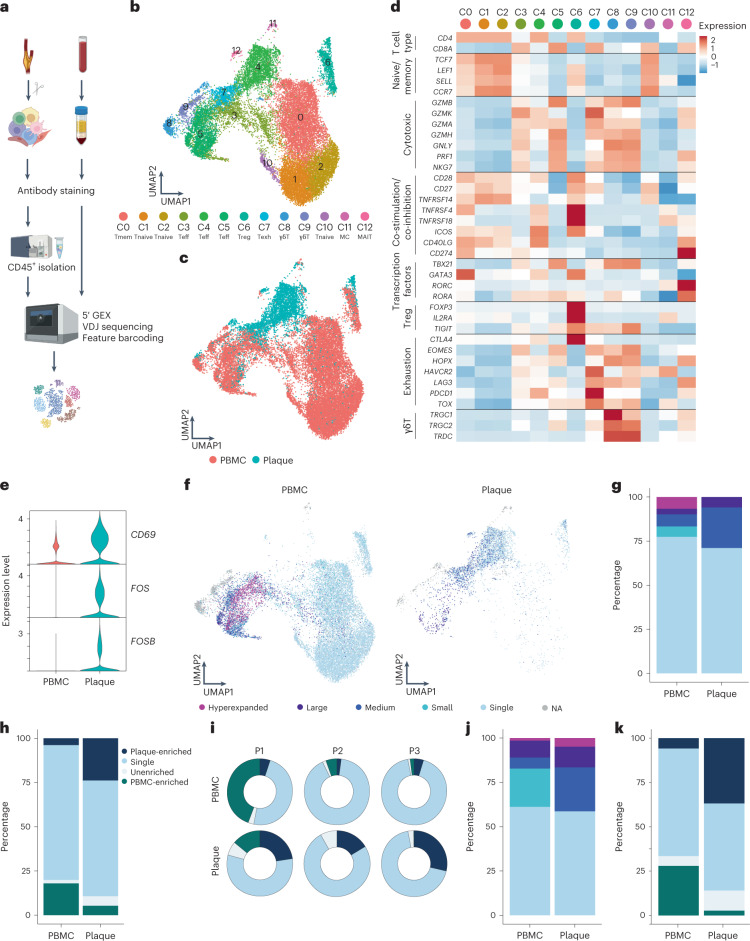
Fig. 2. scTCR-seq reveals clonal expansion and antigen-specific activation of T cells in the plaque.
a, Schematic overview of the study design. Human plaques were enzymatically digested, and live CD45+ cells were sorted using FACS. Matched blood samples were processed to isolate PBMCs. Both plaque cells and PBMCs were then further processed using 10x Genomics and sequenced. b, UMAP depicting 13 distinct T cell clusters resulting from unsupervised clustering (n = 24,443). c, UMAP showing contribution of PBMC or plaque to the T cell clusters. d, Heat map with average expression of T cell function-associated genes. e, Violin plot with expression of CD69, FOS and FOSB in PBMCs and plaque T cells. f, UMAP visualization of clonotype expansion levels among T cells between PBMC and plaque. g, Bar plot with quantification of clonal expansion levels between plaque and PBMC T cells. h, Bar plot with quantification of tissue enrichment scores of clonotypes. i, Circle plots depicting tissue enrichment scores of all T cells per tissue and per patient. j, Bar plot with quantification of clonal expansion levels between PBMC and plaque T cells of bulk TCR-seq data (cohort 3, n = 10). k, Bar plot with quantification of tissue enrichment scores of bulk TCR-seq data (cohort 3). Clonotype expansion levels: Single (one occurrence), Small (≤0.1%), Medium (>0.1% and ≤1%), Large (>1% and ≤10%) and Hyperexpanded (>10%), percentage of all T cells. Tissue enrichment scores: Plaque-enriched (frequency expanded clone higher in plaque versus PBMC), Single (one occurrence), Unenriched (frequency expanded clone similar in PBMC versus plaque) and PBMC-enriched (frequency expanded clone higher in PBMC versus plaque).

