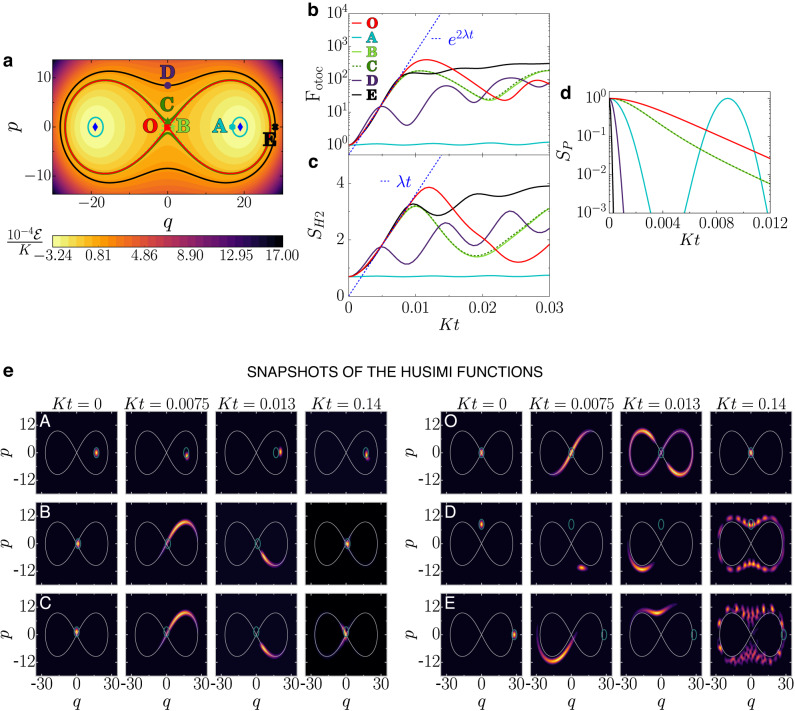
Fig. 2. Phase space and quantum dynamics.
a Energy curves in the phase space obtained with Eq. (2). The hyperbolic point is denoted as O, the center points are represented with blue diamonds, and the solid line intersecting at O is the separatrix. Points O, A–E mark the centers of the initial coherent states chosen for the quantum dynamics. b Evolution of the FOTOC, c Husimi entropy, and d survival probability as a function of time. The exponential [linear] curve with rate [slope] given by the Lyapunov exponent in Eq. (4) are indicated in (b)[c]. e Snapshots of the Husimi functions; each row refers to one of the six initial coherent states investigated, and each column to a different time, as indicated.

