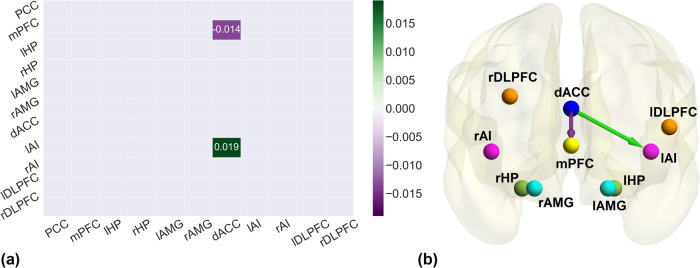
Fig. 3. Association between post-rTMS effective connectivity and emotional health.
a The association matrix between post-rTMS connectivity of active group and emotional health scores. The purple gradient indicates negative association while green gradient shows positive association. b The brain diagram of the association between post-rTMS effective connectivity of active group and emotional health. Green and Purple arrows illustrate the positive and negative association respectively. All the associations reported here survived the threshold of posterior probability >0.95 amounting to a strong evidence.

