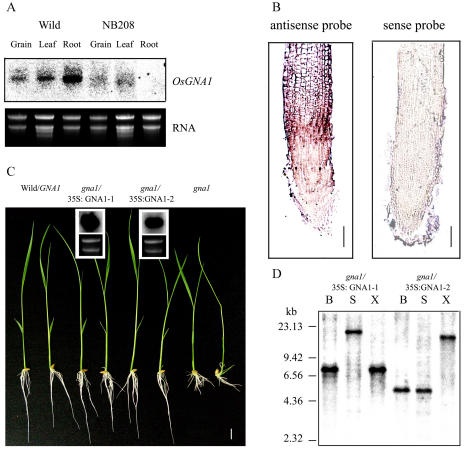
Figure 3.
The expression of OsGNA1 and complementation of the gan1 mutant by the OsGNA1 gene. A, Northern blot of OsGNA1 in different plant tissues. B, OsGNA1 expression in rice root revealed by RNA in situ hybridization with the antisense (left) or sense (right) probes for OsGNA1. C, Seven-day-old seedlings of two representative T2 lines of gna1 harboring the OsGNA1 gene grown at 25°C and the northern blot of the OsGNA1 transcripts in the two lines. The first two are wild-type plants and the last two are gna1 mutants. D, Southern blot of the pCAMBIA2301 insertion in the two transformed lines (gna1 + 35S∷OsGNA1-1 and gna1+35S∷OsGNA1-2 using the NPTII probe). DNA was digested by BamHI (B), SacI (S), and XhoI (X), respectively. The positions of HindIII λ-DNA size markers are indicated on the left.

