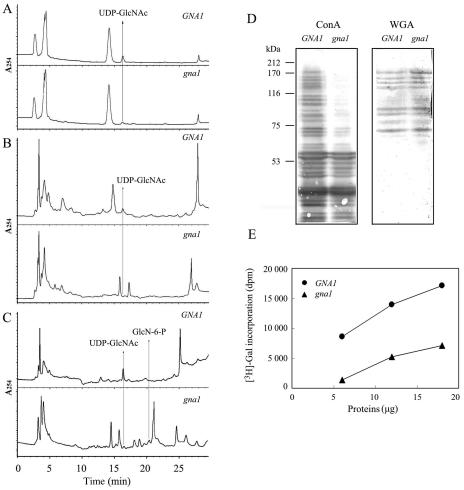
Figure 6.
Decrease of UDP-GlcNAc levels and the differential impairment of downstream routes of UDP-GlcNAc in root cells of the gan1 mutant. A to C, HPLC elution profile at A254 nm. The rice root cells used were from 10-d-old seedlings grown at 32°C (A) or 25°C (B). C, Ten-day-old seedlings supplemented with 10 mm GlcN-6-P for 6 h. Arrows indicate elution positions of UDP-GlcNAc and GlcN-6-P peaks. D, Normalized plant cell extracts were blotted and analyzed using peroxidase-conjugated lectin ConA or WGA. Protein standards are in kilodaltons at the left. E, Cytosolic extracts prepared from roots labeled by β-1,4-galactosyltransferase-mediated [3H]Gal.

