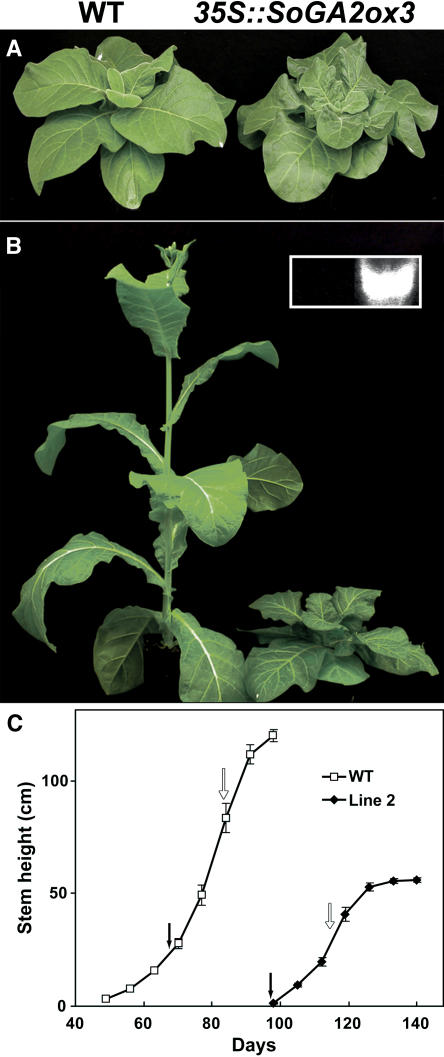
Figure 5.
Ectopic expression of SoGA2ox3 suppresses stem growth in N. sylvestris. A, Transgenic plant and wild-type plant (WT) show a similar phenotype in SD. B, WT and transgenic plants grown in LD following germination. Inset in B shows expression of SoGA2ox3 in the transgenic plant. C, Stem growth of WT and transgenic plants grown in LD following germination. Black arrows indicate the average number of days until appearance of flower buds. White arrows indicate the average number of days until anthesis. n = 12.

