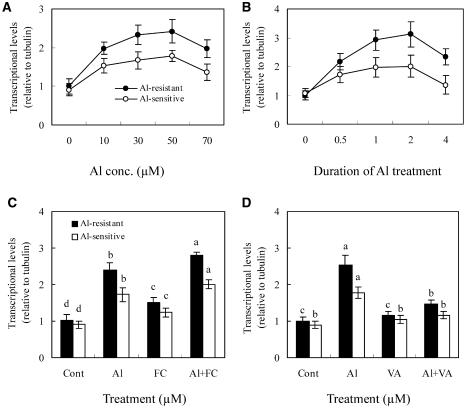
Figure 4.
Quantitative real-time RT-PCR analysis of the transcriptional level of the plasma membrane H+-ATPase gene. After incubation in nutrient solution for 8 d, the seedling roots were treated in the nutrient solution (pH 4.5) as follows. A, Duration of Al treatment was 2 h. B, Concentration of Al was 30 μm. C, Concentration of Al and FC was 30 and 5 μm, respectively, and the duration of treatment was 2 h. D, Concentration of Al and VA was 30 and 100 μm, respectively, and the duration of treatment was 2 h. After the treatment, the root apices (1 cm) were excised and mRNA was isolated. See details in “Materials and Methods.” Each value is the mean ± se (n = 5). Different letters in the same column or cultivar indicate that the values are significantly different at the 0.05 level, according to Duncan's Multiple Range Test.

