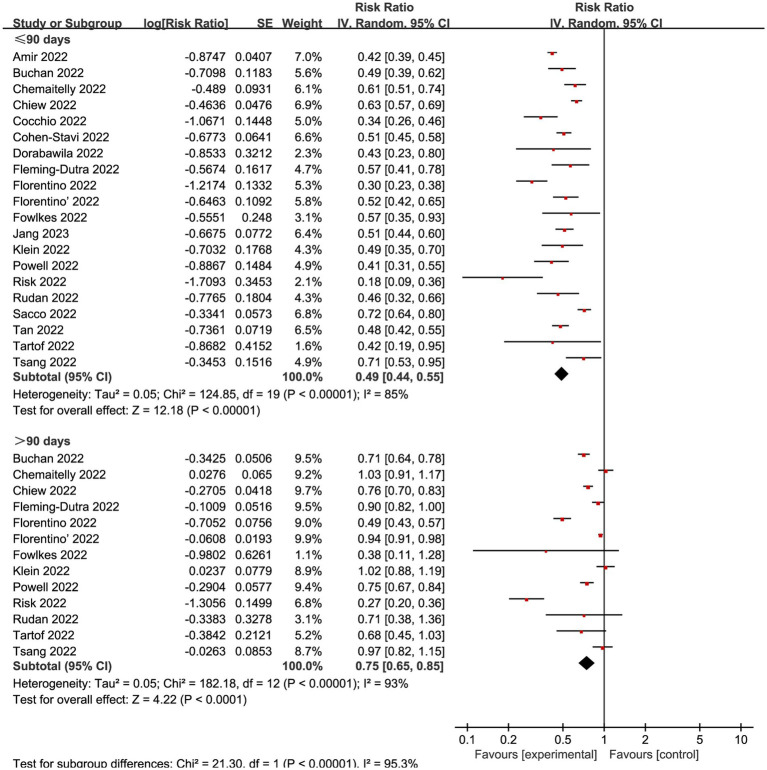
Figure 6.
Forest plot for risk ratios of different time intervals after 2-dose vaccination on preventing mild COVID-19. The red square symbolizes the point estimate for each study, with its size proportional to the study’s weight relative to the summary estimate. The black diamond symbol represents the overall effect estimate derived from the meta-analysis. Meta-analysis based on Random Effects model, inverse variance method (IV). Effect size estimates expressed in Log Risk Ratio [95%CI].

