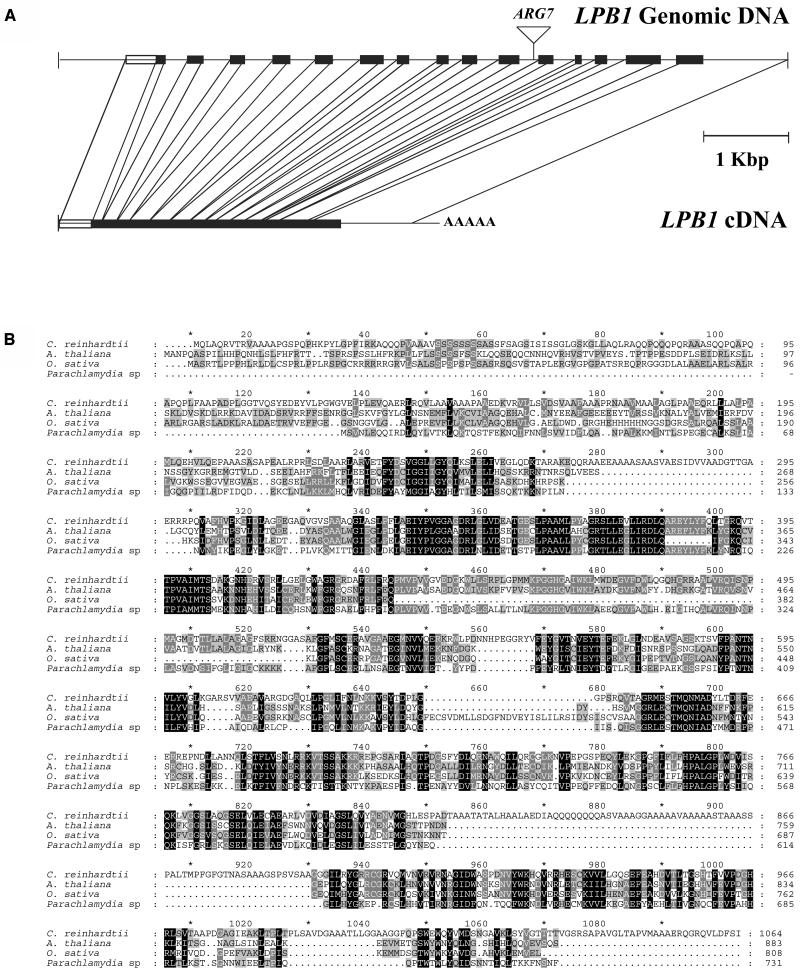
Figure 6.
The LPB1 gene and predicted gene product. A, Structure of LPB1 cDNA and genomic clones. The black rectangles represent the exons, while the lines represent introns. The rectangle at the beginning of the gene sequence represents the part of the cDNA that was deduced by RNA ligase-mediated RACE (see “Materials and Methods”). The site of insertion of the ARG7 gene is marked above the genomic sequence. B, Alignment of predicted LPB1 polypeptide sequence with homologous polypeptides encoded by an expressed sequence of Arabidopsis and hypothetical proteins of O. sativa and Parachlamydia sp. Amino acids in a blackened background represent identical or conserved residues for all four sequences, while amino acids in a gray background represent identical or conserved residues for two or three of the four sequences.

