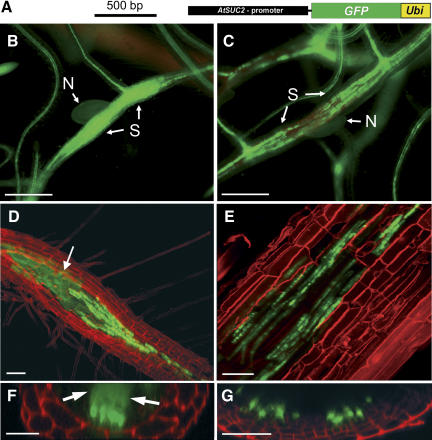
Figure 2.
GFP trafficking from the SE-CC complex into the syncytium. A, Schematic representation of the AtSUC2 promoter∷GFP-UBI construct (Stadler et al., 2005) used in the plants analyzed in C, E, and G. The AtSUC2 promoter is shown in black, the GFP ORF is green, and the coding sequence for UBI (Ubi) is shown in yellow. Plants analyzed in B, D, and F were transformed with the AtSUC2 promoter∷GFP construct shown in Figure 1. B, Epifluorescence microscopic detection of GFP fluorescence in the phloem and in the syncytium of an AtSUC2 promoter∷GFP root 14 d after infection (dai; N, nematode; S, syncytium). The GFP signal is evenly distributed within the syncytium. C, Epifluorescence microscopic detection of GFP-UBI fluorescence in the phloem and in a syncytium of an AtSUC2 promoter∷GFP-UBI root 14 dai. The GFP-UBI signal is detected only in distinct cells. Note: Approximately the same fluorescence intensity is seen in the vascular tissue of the AtSUC2 promoter∷GFP plant shown in A and of the AtSUC2 promoter∷GFP-UBI plants shown in B. D and E, Confocal images of fluorescent cells and of fluorescent syncytia in the root of an AtSUC2 promoter∷GFP plant (D) or of an AtSUC2 promoter∷GFP-UBI plant (E) both recorded 14 dai. The white arrow in D marks the diffuse fluorescence of free GFP in the syncytium that is absent in E. F and G, Optical z-sections of fluorescent cells and of fluorescent syncytia in the root of an AtSUC2 promoter∷GFP plant (F) or of an AtSUC2 promoter∷GFP-UBI plant (G). Both z-sections show distinctly labeled cells at the surface of the syncytia. Diffusion of GFP into the syncytium is only seen in F (white arrows). Roots shown in D to G were treated with propidium iodide to visualize the cell walls. Scale bars represent 500 μm in B and C, 80 μm in D, 40 μm in E, 25 μm in F, and 20 μm in G.

