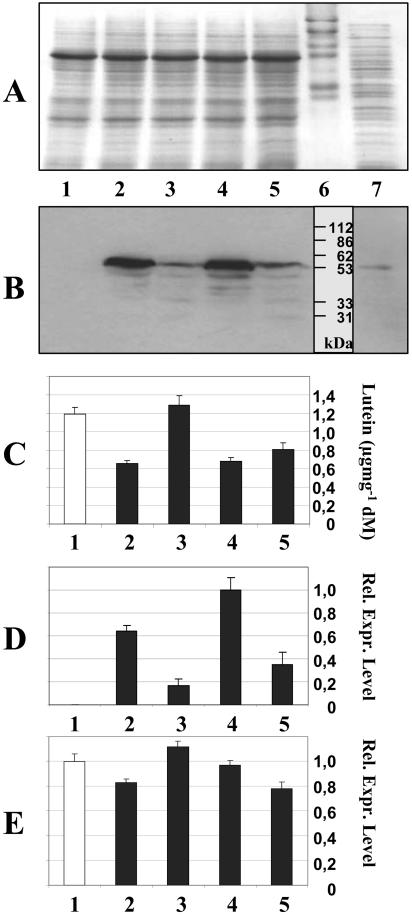
Figure 6.
CrtI RNA and protein expression and lutein content in transgenic Arabidopsis leaves. A, Coomassie Blue-stained SDS-polyacrylamide gel. B, Western blot conducted with anti-CRTI antibodies. C, Lutein content. D, Relative RNA expression levels of CrtI measured by TaqMan real-time PCR (the strongest expressing line 4 was set to 1). E, Relative RNA expression levels of the ɛ-LCY measured by TaqMan real-time PCR (wild type in lane 1 was set to 1). Lane 7, E. coli-expressing CRTI as positive control; lane 6, prestained marker proteins; lane 1, wild-type leaves; lanes 2 to 5, leaves from transgenic Arabidopsis lines. Each bar represents a pool of extracts from 20 siblings. See “Materials and Methods” for details.

