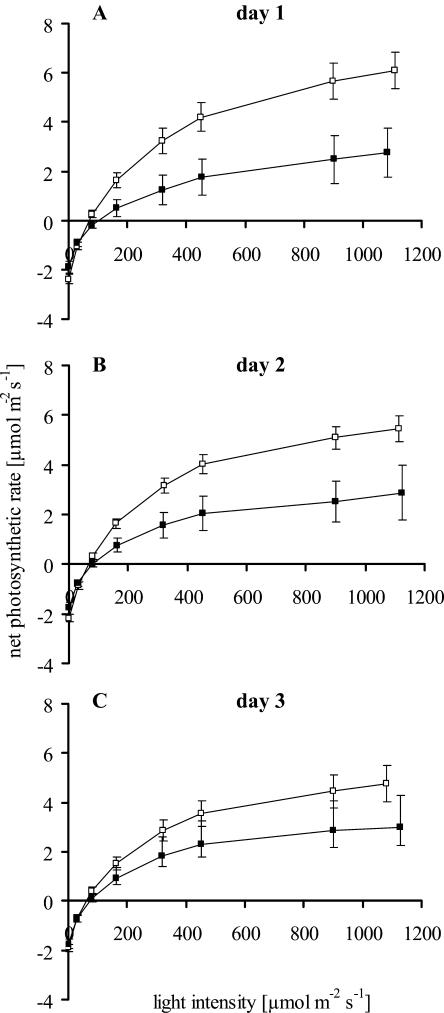
Figure 3.
Light response (net photosynthesis rate) of systemically oviposition-induced (black squares) twigs of Scots pine and untreated controls (white squares) at day 1 to day 3 (A–C). Mean values ± se are given. Ambient CO2 concentration, 350 μmol mol−1 with decreasing PPFD in eight steps (each lasting 10 min) from 1,100 to 0 μmol m−2 s−1. Days 1 and 2 with n = 8; day 3 with n = 7.

