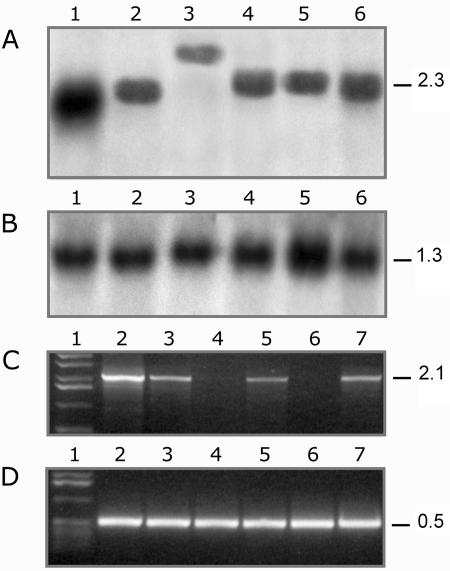
Figure 6.
Northern analysis and RT-PCR analysis of GL1 transcription. A, mRNA extracted from young wild-type leaf (1), young gl1-Ref leaf (2), root (3), old wild-type leaf (4), silk (5), and anther (6) tissue was hybridized with the 3′ end of the GL1 cDNA. B, The same blot in A was stripped and rehybridized with a GAPDH probe. C and D, The presence of GL1 (C) and GAPDH (D) transcripts was assayed by RT-PCR in young wild-type leaf (2), young gl1-ref leaf (3), root (4), old wild-type leaf (5), silk (6), and anther (7) tissue. Size markers present in lane 1 were used to deduce the sizes of amplification products as indicated on the right.

