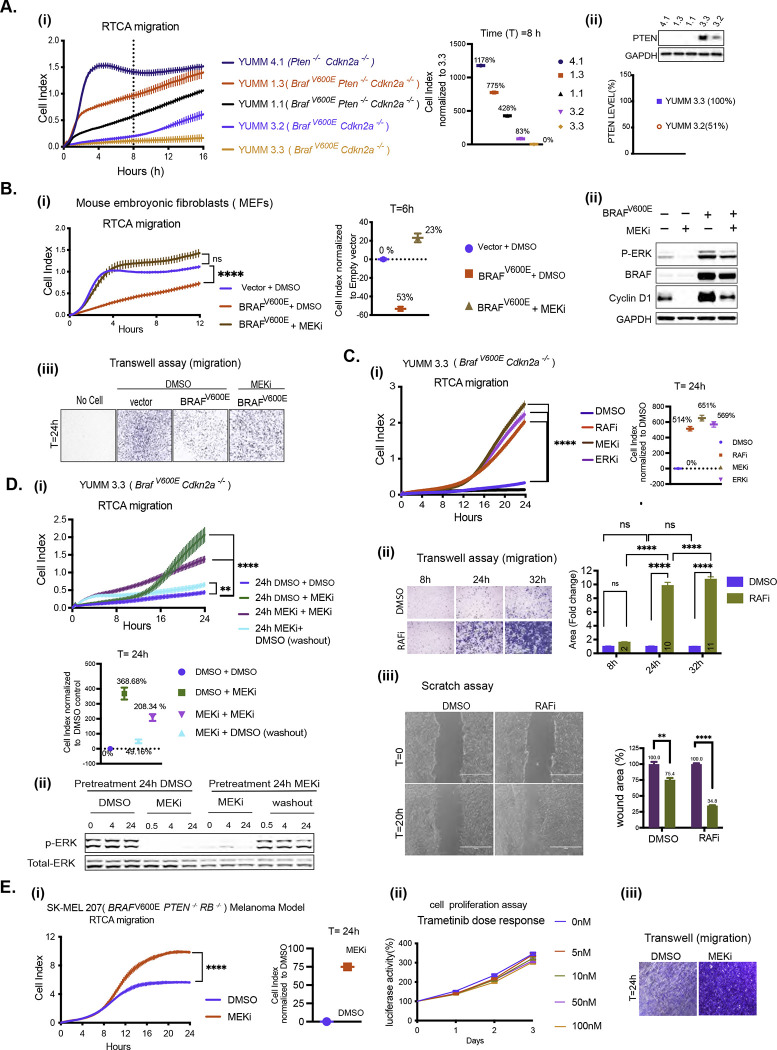
Figure 1. BRAFV600E-driven ERK signaling inhibits cell migration in vitro.
A. i) Migration curves of YUMM 4.1, 1.3, 1.1, 3.3, and 3.2 generated by RTCA. Cell index at 8 hours(h) was normalized to YUMM 3.3. ii) Whole cell lysate (WCL) was analyzed by immunoblotting (IB) to determine PTEN levels. Bands were quantified by densitometry, and the PTEN level was normalized to YUMM 3.3.
B. i-iii) MEFs were transfected with empty vector (Vector) or BRAFV600E plasmid and 36h after transfection, seeded for RTCA, transwell assay and IB. i) Migration with Dimethyl sulfoxide (DMSO) or 10nM Trametinib (MEKi). P-values are based on ordinary one-way ANOVA analysis. Cell index at 6h was normalized to vector. ii) ERK signaling was assayed by IB. iii) Transwell assay was performed with DMSO or 10nM Trametinib and visualized by crystal violet staining (CV) at 24h (n=3).
C. i) Migration of YUMM 3.3 was assessed with DMSO, 1uM Vemurafenib (RAFi), 10nM Trametinib (MEKi), or 500nM SCH 772984 (ERKi) treatment. P-values are based on ordinary one-way ANOVA analysis. Cell index at 24h was normalized to DMSO control. ii) Transwell assay 1uM Vemurafenib was performed as in 1B. Bar graphs depict area with positive CV stain, Error bars mean ± SEM (n=3). P-values are based on two-way ANOVA analysis. iii) YUMM 3.3 cells were plated with DMSO or 1uM Vemurafenib 24 hours before wounding. Bright-field image of the scratch was taken at T=0h (within 30 minutes of wounding) and T=20h. The bar graph depicts the open wound area. Error bars mean ± SE (n=3). P-values are based on multiple unpaired t-tests.
DMSO control. ii) Transwell assay 1uM Vemurafenib was performed as in 1B. Bar graphs depict area with positive CV stain, Error bars mean ± SEM (n=3). P-values are based on two-way ANOVA analysis. iii) YUMM 3.3 cells were plated with DMSO or 1uM Vemurafenib 24 hours before wounding. Bright-field image of the scratch was taken at T=0h (within 30 minutes of wounding) and T=20h. The bar graph depicts the open wound area. Error bars mean ± SE (n=3). P-values are based on multiple unpaired t-tests.
D. i)YUMM 3.3 cells were pre-treated with DMSO or 10nM Trametinib(24h). Pretreated cells were reseeded with either DMSO or 10nM Trametinib for RTCA, and cell index recorded. To wash out the drug, Trametinib pretreated cells were washed with phosphate buffer solution (PBS) three times before seeding in RTCA chambers with DMSO. P-values are based on ordinary one-way ANOVA analysis. Cell index at 24h was normalized to control (24h DMSO + DMSO). ii) Cell pellets were collected at indicated times, and ERK signaling was analyzed by IB.
E. i) Migration of SK-MEL207 with DMSO or 10nM Trametinib. Cell index at 24h was normalized to DMSO control. P-values are based on two-tailed unpaired Student’s t-test ii) Cells were seeded in 96 well plates and treated with DMSO or Trametinib. At indicated times, cell growth was measured using CellTiter-Glo Cell Viability Assay. Error bars mean ± SD (n=6). iii) Transwell assay, was performed with 10nM Trametinib(24h) treatment and visualized by CV(n=3).
Migration curves with vertical error bars represent mean ± SEM (n=3). P<0.0001 is shown as ****, P<0.001 as ***, P< 0.01 as **, and P>0.05 as ns.
Also, see SF1.

