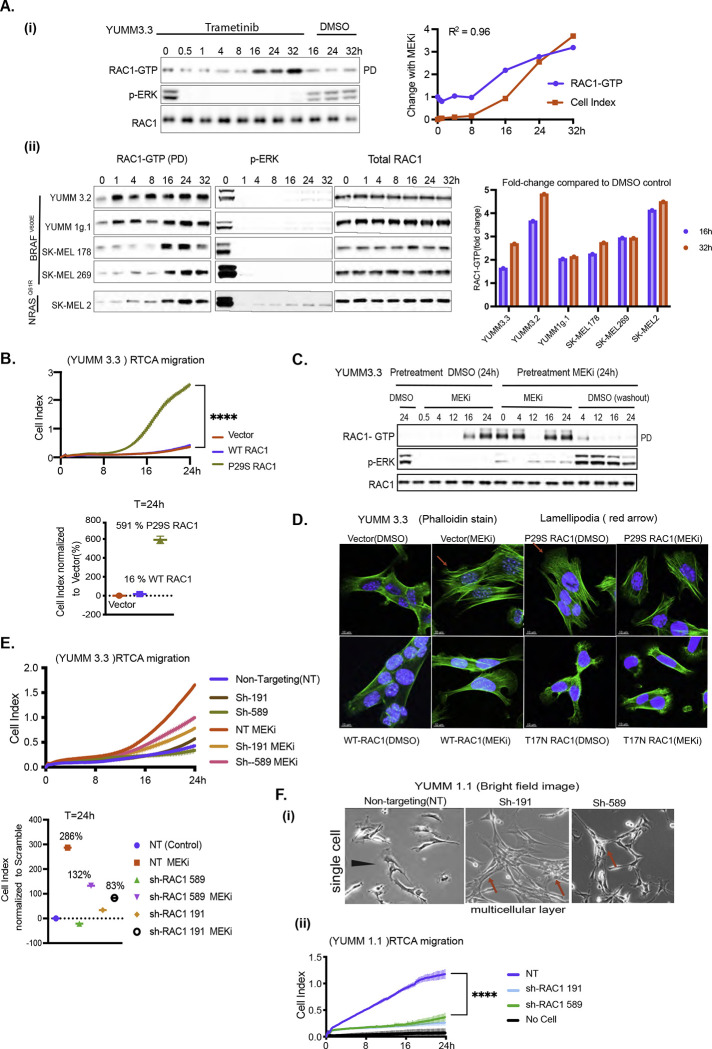
Figure 4: RAC1 activation causes mesenchymal transition and enhances cell motility upon ERK inhibition.
A. i) YUMM 3.3 cells were treated with 10nM Trametinib (MEKi) for indicated times. RAC1-GTP levels were determined using the active RAC1 pull-down (PD) assay. Total RAC1 and phosphorylated ERK (pERK) was assayed by IB the WCL. Induction of RAC1-GTP and induction of migration upon MEK inhibition were quantified, normalized to DMSO control at T=0h, and plotted as a function of time. (ii) Indicated cell lines were treated with Trametinib and RAC1-GTP, RAC1 and pERK were detected as above. Bar graph depicts the fold change in RAC1-GTP upon MEK inhibition.
B. An activated RAC1 mutant rescues migration in BRAFV600E cells. Migration of YUMM 3.3 expressing empty vector, WT RAC1, or constitutively active mutant RAC1P29S (1ug/ml doxycycline 24h). P-values are based on ordinary one-way ANOVA analysis. CelI Index at 24h was normalized to those with an empty vector.
C. YUMM 3.3 cells were pretreated with DMSO or 10nM Trametinib for 24 hours and each population was split and replated with DMSO or 10nM Trametinib. To wash out the drug, Trametinib pretreated cells were washed with PBS three times before seeding. WCL was collected at indicated times and RAC1-GTP, pERK and Total RAC1 was analyzed as in 4A.
D. Actin filaments were visualized with phalloidin stain(green) in YUMM 3.3 expressing inducible empty vector, WT RAC1, RAC1P29S, or RAC1T17N (1ug/ml doxycycline 24h) after treatment with 10nM Trametinib (24h).
E. Knockdown of RAC1 expression prevents rescue of migration by MEK inhibition. Migration of YUMM 3.3 cells expressing non-targeting (NT) or two different short hairpins against RAC1: sh-RAC1 19, and sh-RAC1 589, with or without 10nM Trametinib. Cell index at 24h is normalized to NT hairpin with DMSO. P-values are based on ordinary one-way ANOVA analysis
F. Knock down of RAC1 prevents mesenchymal phenotype and migration (i) Brightfield image of YUMM 1.1 cells expressing either NT or short hairpins against RAC1, sh-RAC1 191, and sh-RAC1 589. Magnification 10X (ii) Migration of YUMM 1.1 cells expressing either NT or sh-RAC1 191, and sh-RAC1 589.
Curve with vertical error bars represents mean ± SEM (n=3).
Also, see SF4

