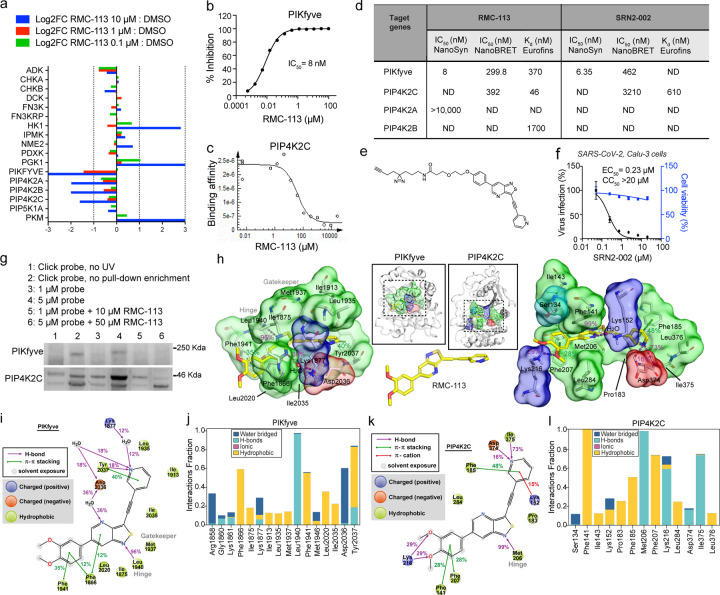
Fig. 2: RMC-113 is a selective kinase inhibitor that stably binds PIKfyve and PIP4K2C.
a, Kinase abundance ratio between RMC-113 (0.1, 1.0, and 10 μM)- and DMSO-treated SUM159 cell lysates measured following affinity purification via multiplexed inhibitor beads kinome profiling and analyzed by mass spectrometry (MIB/MS). Shown are the Log2 fold change values of a subset of the screen panel (see Supplementary Fig. 2a). Data means ± SD of 2 replicates are shown.
b and c, In vitro dose response to RMC-113 of PIKfyve activity (b) and PIP4K2C binding (c).
d, Biochemical parameters for RMC-113 and SRN2–002. ND=Not determined
e, Chemical structure of SRN2–002.
f, Dose response to SRN2–002 of SARS-CoV-2 (MOI = 0.05) infection (black) and cell viability (blue) in Calu-3 cells via plaque and alamarBlue assays at 24 hpi, respectively.
g, PIKfyve and PIP4K2C expression in lysates of SARS-CoV-2-infected A549-ACE2 cells following incubation with SRN2–002 individually or in combination with RMC-113, UV irradiation, and pull down by streptavidin beads measured via Western blotting at 24 hpi. Shown are representative membranes of 2 experiments. Lanes: 1: SRN2–002, no UV; 2: SRN2–002, no pull-down enrichment; 3: SRN2–002 (1 μM); 4: SRN2–002 (5 μM); 5: competitive inhibition of SRN2–002 (1 μM) with RMC-113 (10 μM); 6: competitive inhibition of SRN2–002 (5 μM) with RMC-113 (50 μM).
h, Putative binding mode of RMC-113 into the ATP-binding pockets of PIKfyve and PIP4K2C based on microsecond timescale MD simulations. A representative snapshot with key interactions are shown. Binding pocket residues with >10% interaction frequencies to RMC-113 are shown. Residues with positive charge are highlighted with blue molecular surface; negative charge, red; hydrophobic, green; polar, cyan. RMC-113 is shown in yellow (carbon) stick model. H-bonds are illustrated with purple dashed lines, π–π interactions with green. See Supplemental Fig. 2f for more detailed simulation interactions.
i and k, Summary of the observed main protein-ligand interactions in the MD simulations of PIKfyve (i) and PIP4K2C (k). Interactions with >10% frequency are displayed.
j and l, Aggregate of protein-ligand interactions (residues with >10%) in the simulations of PIKfyve (j) and PIP4K2C (l).
Data in (i and j) consist of 72 μs, and (k and l) consist of 20 μs, both analyzed each 1 ns.

