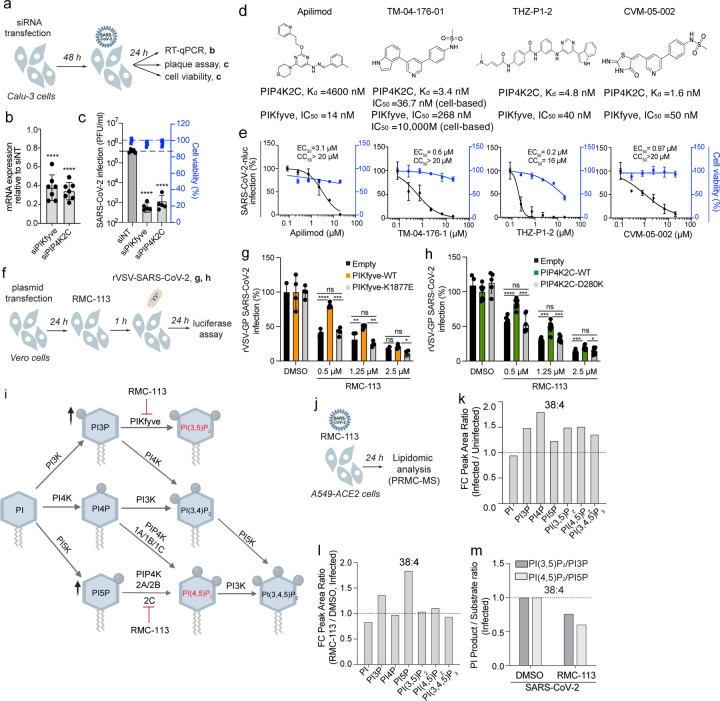
Fig. 3: PIKfyve and PIP4K2C are essential for SARS-CoV-2 infection and mediate the antiviral effect of RMC-113.
a, f, j Schematics of the experiments in b, c (a); g, h (f); and k, l, m (j).
b, Confirmation of siRNA-mediated knockdown by RT-qPCR in Calu-3 cells. Shown are gene expression levels normalized to GAPDH relative to respective gene levels in siNT control at 48 hours post-transfection.
c, Viral titers (PFU/ml) and cell viability (blue) in Calu-3 cells transfected with the indicated siRNAs at 24 hpi with SARS-CoV-2 (MOI = 0.05) via plaque and alamarBlue assays, respectively.
d, Structures of PIKfyve and/or PIP4K2C inhibitors.
e, Dose response of rSARS-CoV-2-nLuc (black, USA-WA1/2020 strain, MOI = 0.05) infection and cell viability in Calu-3 cells via luciferase and alamarBlue assays at 24 hpi, respectively.
g and h, Rescue of rVSV-SARSCoV-2-S infection under RMC-113 treatment upon ectopic expression of WT PIKfyve (g) and PIP4K2C (h), their kinase-dead mutants or empty control plasmids measured by luciferase assays at 24 hpi in Vero cells.
i, Phosphoinositides and associated kinases.
k and l, Fold change (FC) of peak area ratio of the indicated phosphoinositides in SARS-CoV-2-infected (MOI = 0.5) vs. uninfected (k) and RMC-113- vs. DMSO-treated infected Calu-3 cells (l), as measured via PRMC-MS.
m, Product-to-substrate ratios in RMC-113- vs. DMSO-treated cells infected with SARS-CoV-2 (k, l).
Data is relative to siNT (b, c) or DMSO (e, g, h). Data are a combination (b, c, e, g, and h) or representative of 2 independent experiments with 2–4 replicates each. Means ± SD are shown (b, c, g, h). k, l, m represent one of two independent experiments. See an associated experiment in Supplemental Fig. 5e-g and Table S2. *P ≤ 0.05, **P < 0.01, ***P <0.001, ****P <0.0001 by 1-way ANOVA followed by Dunnett’s (b, c) or Tukey’s multiple-comparison test (g, h).

