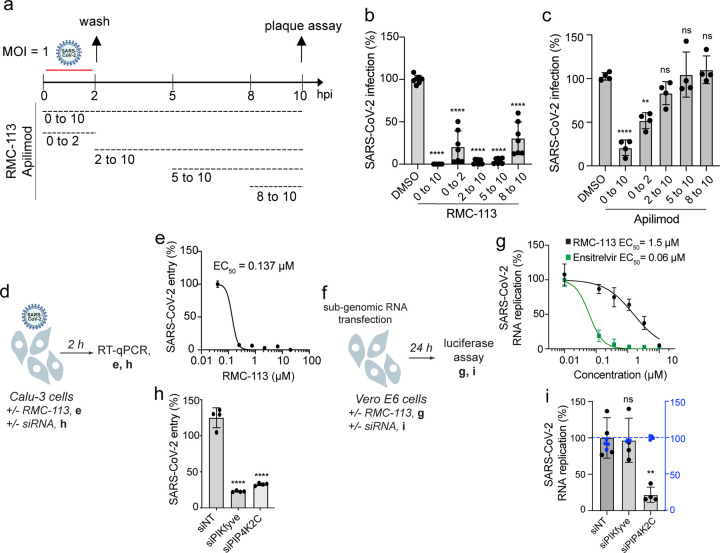
Fig. 4: PIP4K2C is required for temporally distinct stages of the SARS-CoV-2 life cycle, whereas PIKfyve is required for viral entry only.
a, Schematic of the time-of-addition experiments shown in b, c.
b and c, Calu-3 cells were infected with WT SARS-CoV-2 (MOI = 1). At the indicated times, RMC-113 (10 μM) (b), apilimod (10 μM) (c), or DMSO were added. Supernatants were collected at 10 hpi, and viral titers measured by plaque assays.
d and f, Schematics of the experiments shown in e, h (d) and g, i (f).
e, Dose response to RMC-113 of WT SARS-CoV-2 entry (MOI = 1) in Calu-3 cell lysates measured by RT-qPCR assays at 2 hpi.
g, Dose response to RMC-113 and ensitrelvir of viral RNA replication measured by luciferase assay in Vero E6 cells 24 hours post-transfection of in vitro transcribed nano-luciferase reporter-based SARS-CoV-2 subgenomic non-infectious replicon38.
h, WT SARS-CoV-2 (MOI = 1) entry measured in Calu-3 cells depleted of the indicated kinases using corresponding siRNAs by RT-qPCR at 2 hpi.
i, Viral RNA replication and cell viability (blue) measured by luciferase and alamarBlue assays, respectively, in Vero E6 cells depleted of the indicated kinases, 24 hours post-transfection of in vitro transcribed nano-luciferase reporter-based SARS-CoV-2 subgenomic non-infectious replicon38.
Data are a combination (b, c, e, g, h) or representative (i) of two independent experiments with 2–4 replicates each. Means ± SD are shown. Data is relative to DMSO (b, c, e, g) or siNT (h, i). **P < 0.01, ****P <0.0001 by 1-way ANOVA followed by Turkey’s (b,c) or Dunnett’s (h, i) multiple-comparison test. ns= non-significant.

