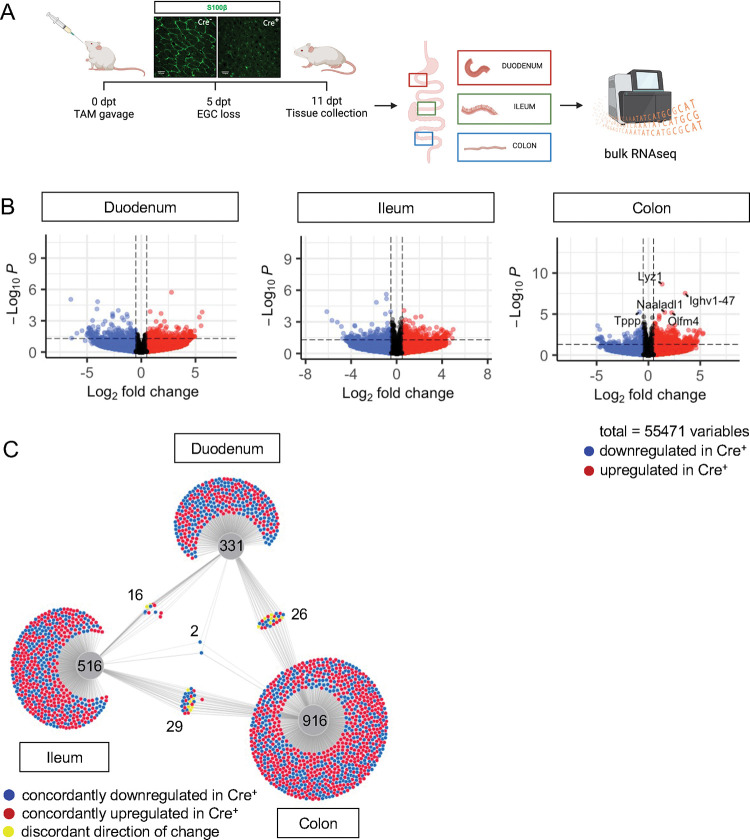
Figure 2. Glial ablation induces muted, region-specific transcriptional changes along the longitudinal axis of the intestine.
A) Schematic of the experimental timeline for bulk-sequencing of intestinal tissue segments from male Plp1CreER Rosa26DTA/+ mice (annotated as Cre+) and Rosa26DTA/+ littermate controls (annotated as Cre−). Tissues were collected 11 days after administration of tamoxifen (11dpt; n = 4 per genotype). In this model, the majority of enteric glial cells (EGC) are eliminated by 5dpt and the deficit is stable through at least 14dpt [12].
B) Volcano plots showing differentially expressed genes in duodenum, ileum, and colon of Cre− and Cre+ mice. Genes that reached statistical significance cutoff of padj < 0.05 are labeled. Red and blue colors denote up- and down-regulated genes in Cre+ mice compared to Cre− mice with p-value < 0.05, respectively. Differential analysis was conducted using DESeq2.
C) DiVenn analysis illustrates genes that were up- (red) or down-regulated (blue) in the duodenum, ileum, and colons of Cre+ mice compared to Cre− controls at 11dpt with p<0.05 threshold for significance. Nodes linking tissues constitute the genes that were differentially expressed in Cre+ mice compared to controls in both of those tissues. Yellow color marks genes with discordant direction of change between the different tissue regions. Numbers indicate the number of genes at each node or tissue segment that were identified as differentially expressed. Overall, this analysis illustrates that most differentially expressed genes in Cre+ mice were region-specific with little overlap between duodenum, ileum, and colon.

