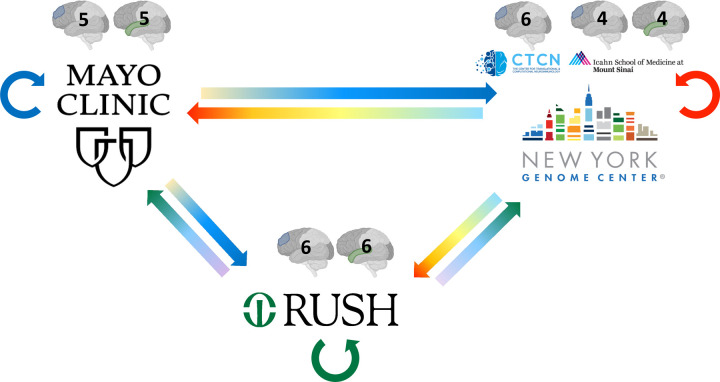
Figure 3. RNAseq sample swaps.
To evaluate the technical variability of RNA sequencing amongst the three sites, RNA tissue from the same brain was sequenced at each site for a small number of samples. The number and region of samples exchanged are illustrated with the grayscale brain image with the exchanged tissue highlighted in color (DLPFC in blue, STG in green). Straight arrows represent tissue exchange; circular arrows represent tissue sequenced at the original site, shown in blue, green, and red circular arrows for Mayo Clinic, Rush, and NYGC, respectively. Samples from MSSM (4 DLPFC, 4 STG) and Columbia (5 DLPFC) were utilized for the swap experiment at NYGC.

