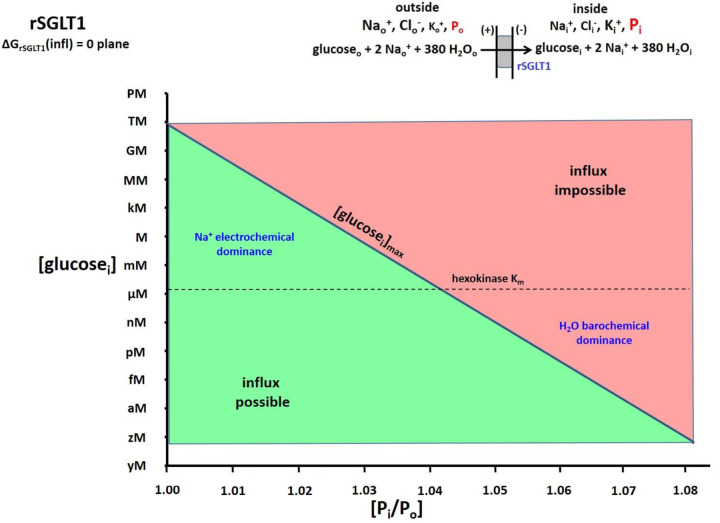
Figure 7. The 2D plot of the ΔGrSGLT1(influx) = 0 plane from a 3D plot similar to Figure 4.
Equation (6) was used and, in this case, the extracellular glucose concentration, [glucoseo], the membrane potential, Em,oi, and Po were held fixed at 5 mM, −91 mV, and 1 atm, respectively (T = 310 K). The surface is colored green when influx is thermodynamically possible and red when it is impossible. Thus, the intersection of the ΔG surface with the ΔG = 0 plane traces the trajectory of the (Pi/Po)-dependence of the (in this case) maximum intracellular glucose− concentration, [glucosei]max, value allowing uptake. The Km value of the cytoplasmic hexokinase for glucosei (1.7 μM) is indicated with a horizontal dashed line. It is clear when Pi is small, tremendous values of [glucosei] are allowed, which would easily saturate hexokinase. However, this is not the case when Pi is only a few percentage points greater.

