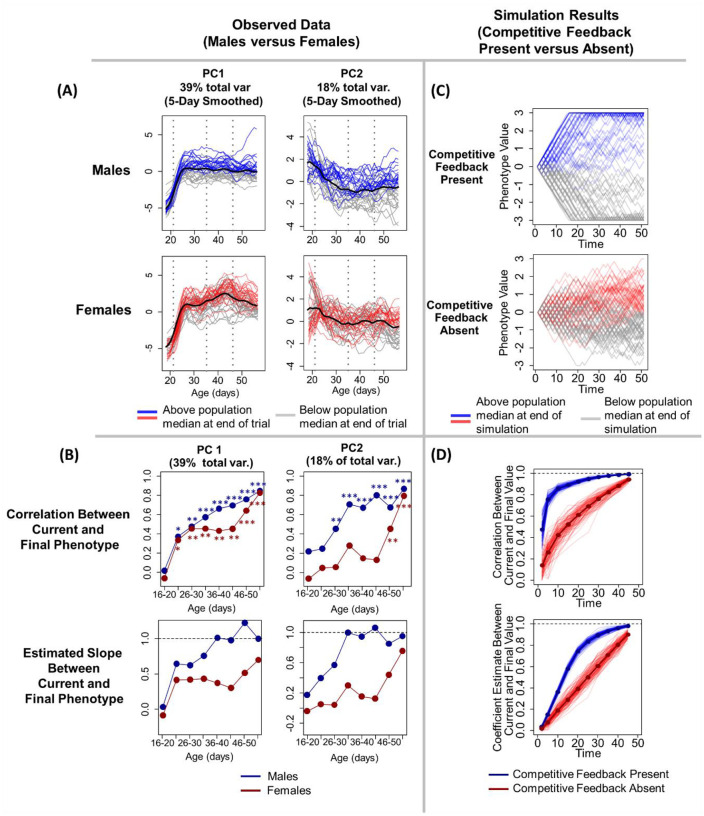
Figure 1. Males adopt their adult phenotypes earlier than females.
(A) Traces of observed individual behavioral PC1 and PC2 values, smoothed over five days, across animals’ development. Lines are color-coded to indicate individuals’ behavior during the last three days of the experiment (age 56–58), with lines representing animals that displayed higher than median phenotype during this period in red or blue and animals that displayed lower than median phenotype in grey. (B, first row) The correlation between earlier and adult behavior is stronger in males for both PC1 (left column) and PC2 (right column). The y-axis represents the correlation coefficient between individuals’ behavior at the age-window on the x-axis and their behavior at the end of the experiment (age 56–68 days). Asterisks denote significance of the correlations depicted in each point (* p < 0.05, ** p < 0.01, *** p < 0.001). (B, second row) The slope of the relationship between earlier and adult behavior (y-axis). The slope of this relationship is consistently closer to 1 for males than for females. (C-D) Each of the observed results in (A) and (B) are closely mirrored by agent-based simulations in which simulated individuals’ phenotypes develop either in the presence (blue) or absence (red) of competitive feedback mechanisms. (C) Traces of individual phenotypes from a single run of the simulation, with shading of traces matching (A). (D) Results from 1,000 iterations of the simulation. Comparable to (B), relationships between current and future behavior are stronger when competitive feedback is present. Detailed description of the simulation can be found in the main text and methods.

