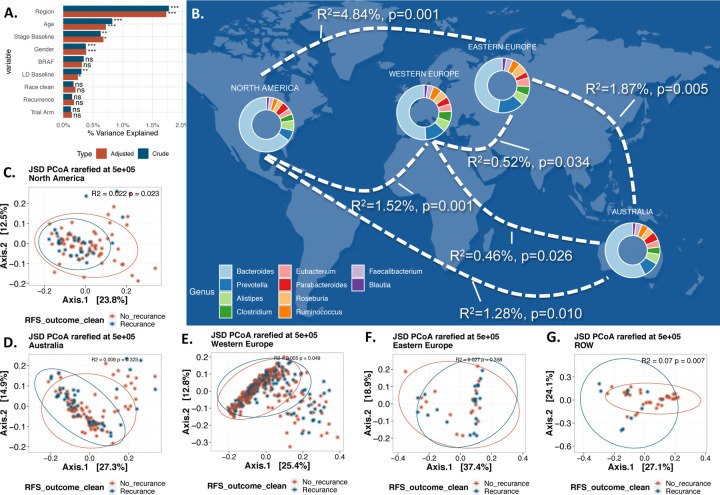
Figure 1. Beta Diversity, Regional Variation and Melanoma Recurrence.
(A) illustrates a PERMANOVA analysis of essential clinical and demographic variables within our study, using JSD distance. Color indicates the analysis type: crude in blue and adjusted (adjustment for each other variable) in orange. The x-axis denotes R2, reflecting the proportion of overall gut microbiota composition variance, with stars adjacent to the bars indicating significance (p-values: 0.05 *, 0.01 **, 0.001 ***, >0.05 NS). Panel (B) presents a map of the geographic regions, with paired PERMANOVA results for each geographic pair displayed on the plotted curves. All pairs exhibited significant differences. Donut charts plotted over each geographic region represent the top 10 genera across (based on abundance) all samples within that region. Panels (C-G) depict the principal coordinate analysis (PCoA) for each of the five geographic regions, considering recurrence as the outcome (R2 and p-values are provided for each region).

